The one mimalloc heap profiler that runs natively on Windows. Upstream mimalloc has no profiler at all, and the only other known implementation (Bun's, surveyed in
MIMALLOC_FORKS.md) is POSIX-only — its stack capture is guarded behind glibc/Apple<execinfo.h>.
A fork of microsoft/mimalloc that adds pprof-compatible sampled heap profiling, with native Windows as a first-class target alongside Linux and macOS.
   __  __ ___ __  __    _    _     _     ___   ____
  |  \/  |_ _|  \/  |  / \  | |   | |   / _ \ / ___|
  | |\/| || || |\/| | / _ \ | |   | |  | | | | |
  | |  | || || |  | |/ ___ \| |___| |__| |_| | |___
  |_|  |_|___|_|  |_/_/   \_\_____|_____\___/ \____|

   ____  ____  ____   ___  _____
  |  _ \|  _ \|  _ \ / _ \|  ___|
  | |_) | |_) | |_) | | | | |_
  |  __/|  __/|  _ <| |_| |  _|
  |_|   |_|   |_| \_\\___/|_|

      PPROF-COMPATIBLE SAMPLED HEAP PROFILING
      WINDOWS FIRST-CLASS | LINUX | MACOS


    malloc / free
          |
          v
          +------------------+
          |     mimalloc     |
          |       |
          |   [ live heap ]  |
          +---------+--------+
         |
         | sampled allocations
         v
+------------------+      +--------------------------+
|    heap.prof     | ---> |      google/pprof        |
| heap_v2 / proto  |      | flamegraphs | top | diff |
+------------------+      +--------------------------+
The allocator tracks sampled live allocations and writes either the gperftools
heap_v2 text format or an uncompressed pprof profile.proto. Both open directly
in google/pprof for flame graphs, call graphs,
top reports, and profile diffs.
Profiling is opt-in at runtime: a build with MI_PPROF=ON (the default) does
not sample until you call a start API or set MIMALLOC_PROF=1.
Platforms. Linux, macOS, and Windows — with both MSVC and MinGW as required CI targets, on every commit, in Debug and Release. MinGW being a gate rather than an afterthought is how the leaks in Bugs fixed in older versions were found; upstream has no MinGW job.
Contents
- Quick start
- Choosing a version: v2 or v3
- Bugs fixed in older versions — including two unbounded memory leaks
- What this fork carries — every divergence, with its source
- C and C++ integration
- Rust integration
- Profiler reference
- Memory-events API
- Performance — continuous benchmarks vs. upstream mimalloc, TCMalloc, and jemalloc
- For maintainers
[dependencies]
mimalloc-pprof = "0.9"

[profile.release]
debug = "line-tables-only"
strip = false
use mimalloc_pprof::{prof, MiMalloc};
use std::path::Path;
#[global_allocator]
static ALLOCATOR: MiMalloc = MiMalloc;
fn main() -> std::io::Result<()> {
assert!(prof::start(0), "profiler already running"); // 0 = default, ~512 KiB
let retained = vec![0_u8; 1024 * 1024];
prof::dump_file(Path::new("heap.prof"))?; // dump while still live
std::hint::black_box(&retained);
prof::stop();
Ok(())
}cmake -S . -B build -DMI_PPROF=ON -DCMAKE_BUILD_TYPE=RelWithDebInfo
cmake --build build --config RelWithDebInfo#include <mimalloc.h>
#include <mimalloc/profile.h>
int main(void) {
if (!mi_prof_start(0)) return 1; /* 0 = default interval, ~512 KiB */
void* p = mi_malloc(1024 * 1024);
if (!mi_prof_dump("heap.prof")) return 2; /* dump while it is still live */
mi_free(p);
mi_prof_stop();
return 0;
}mi_prof_start and mi_prof_dump are nodiscard — check their results or the
compiler will warn.
MIMALLOC_PROF=1 MIMALLOC_PROF_DUMP_AT_EXIT=heap.prof ./my_apppprof -http=:0 ./my_app heap.prof # interactive
pprof -top ./my_app heap.prof # text summaryBuild with debug info, and on MSVC keep the matching PDB next to the binary.
when in doubt chose v3 or later, which is the default latest
Two engine lines are published as two version ranges of the same crate. The profiler API, environment variables, and output formats are identical in both, so switching is a version bump, not a code change.
| v3 — current | v2 — previous | |
|---|---|---|
| Crate | mimalloc-pprof 0.9.x |
0.8.x |
| Lives on | main |
the v2 branch |
| Upstream base | mimalloc v3 (upstream/dev3) |
mimalloc v2 (upstream/main) |
| Allocator design | arena-of-slices + page-map; mi_heap_t/mi_theap_t split |
segment allocator |
| Allocator statistics | per-heap and per-subprocess | process-wide totals only |
| Memory under thread churn (MinGW) | flat | leaked in published 0.8.0; fixed on the v2 branch — bug 1 |
Use v3 (0.9.x) unless you have a specific reason not to. It has strictly more test coverage, richer statistics, and fixes two upstream bugs that v2 still had.
The caveat worth stating plainly: upstream mimalloc v3 (dev3) is still a
pre-release branch. It has had less field exposure than v2 no matter how green a
test suite looks. That risk is real and testing cannot retire it — see
how v3 was validated for exactly what was measured.
Published versions of the mimalloc-pprof
crate on the v3 line, newest first. Dates are crates.io publish dates (UTC). This table
is a summary; the full notes, with the reasoning behind each fix, are the record in
rust/mimalloc-pprof/CHANGELOG.md.
| Version | Published | What landed |
|---|---|---|
| 0.9.3 | 2026-08-21 | Fix: the crate would not build for aarch64-pc-windows-msvc. mimalloc's MSVC atomics wrapper reaches for ARM64 Interlocked intrinsics that clang-cl does not declare, so a cargo-xwin cross build failed to compile (#223, #224). Also the first release carrying the v4 line, merged into main after 0.9.2 (#129): upstream engine pin 579f8c0e -> bcee5a88 (#80, #113), the new experimental mi_option_purge_zeroes zero-tracking option (#67, #79), the zeroing-realloc family exposed from Rust (#83, #108), and several allocator fixes. |
| 0.9.2 | 2026-08-01 | Fix: seeded sampling is now actually reproducible. mi_prof_start_seeded and MIMALLOC_PROF_SEED mixed the ASLR-randomised address of the thread's allocator state into the seed, so a pinned seed produced a different sample sequence in every process while the docs promised determinism (#91). |
| 0.9.1 | 2026-08-01 | Hardening release, no API change. Fixes: a -DMI_BUILD_SHARED=ON -DMI_BUILD_STATIC=OFF build failed to link, because four test targets hardcoded mimalloc-static (#62, #68); -Wmaybe-uninitialized on fmt_buf in src/profile.c (#72). Plus five new CI gates, each with a positive control proving it can fail. |
| 0.9.0 | 2026-07-31 | Features: first release of the v3 line -- profiler and memory-events ported onto mimalloc v3 (#29, #44), v3 promoted to mainline with v2 preserved on the v2 branch (#46), and the v3 allocator counters exposed in the profile, surfaced from Rust as ProfStats::heap (#43). Fixes: two upstream mimalloc defects -- MinGW thread-exit cleanup and the mi_heap_new / mi_subproc_new bootstrap crash (both #43, detailed under Bugs fixed in older versions). |
0.9.4 -- merged to main, not yet released. The aarch64-pc-windows-msvc fix that
shipped in 0.9.3 was a build-script allowlist matching a single target triple, so it only
helped consumers building through the Rust crate -- CMake, src/static.c, and anyone
vendoring the C directly still selected the broken path. It is replaced by a capability
test in include/mimalloc/atomic.h: the MSVC atomics wrapper is now gated on
MI_HAS_C11_ATOMICS, derived from __STDC_VERSION__ >= 201112L && !defined(__STDC_NO_ATOMICS__) (#230, #231). _MSC_VER means "claims
MSVC source compatibility", not "lacks C11 atomics", and clang-cl defines it but is
clang. Real MSVC keeps the wrapper: it omits __STDC_VERSION__ without /std:c11, and
under /std:c11 defines __STDC_NO_ATOMICS__ unless /experimental:c11atomics is also
passed. Until 0.9.4 is published, Cross-compilation describes the
mechanism that is actually on crates.io.
The v2 line (0.8.x) is maintained on the
v2 branch.
This section exists because the bugs below are defects in upstream microsoft/mimalloc, not in the profiler, and they affect anyone using mimalloc on Windows/MinGW whether or not they use this fork.
Every one was confirmed by building stock upstream at the same commit with the same toolchain and reproducing it there with zero fork changes. Where a fix is claimed, the measurement is given.
| Affects | upstream v2 and v3, Windows/MinGW (GCC) only — MSVC is unaffected |
| Symptom | every exiting thread leaks its thread-local heap and all its pages |
| Status | fixed on both lines — v3 in 0.9.0; v2 on the v2 branch, not yet in a published 0.8.x |
Memory grew linearly and without bound — about 0.24 GB per iteration of
test-stress, reaching 23.5 GB at 100 iterations. The process still exited 0,
so it is invisible on a large-memory machine and only surfaces as an
out-of-memory failure on a smaller one.
Root cause. Windows' default init mode registers its loader TLS callbacks using
MSVC-only pragmas — #pragma comment(linker, "/INCLUDE:...") plus
const_seg/data_seg — which GCC silently ignores. The .CRT$XL* entries are
never emitted, so DLL_THREAD_DETACH never fires and _mi_thread_done never runs.
The two lines need different fixes. This is the non-obvious part, and matters if you are patching upstream yourself:
- v3 — register the callbacks with GCC section attributes plus a
_tls_usedreference. That is sufficient, because v3 keeps its thread state in its own TLS slots. Peak RSS 34.64 GB → 0.02 GB; livetheaps1857 → 5. - v2 — the same registration is not sufficient. v2's default heap lives in a
mi_decl_threadvariable, which GCC implements with emutls on MinGW, and emutls is torn down before any PE TLS callback runs. The callback then observes an already-empty heap and_mi_thread_doneearly-returns. v2 must use the FLS path instead, where the callback receives the stored value as an argument. Peak RSS 23.50 GB → 0.28 GB.
Why it went unnoticed upstream: upstream CI has no MinGW job, and the only Windows init mode with a documented non-MSVC path is the deprecated FLS one.
| Affects | upstream v3 |
| Symptom | crash when either is the first mimalloc call in a process |
| Status | fixed in 0.9.0 |
Either function can be the first mimalloc call a process makes, but neither
initialized the library, so both allocated from a still-NULL subproc->heap_main.
It presented as Windows-only because on Linux and macOS a library constructor has always run first. It is not debug-only: in a release build the assertions compile out and the code proceeds to allocate from a NULL heap.
Upstream issue #1341
(free(NULL) before initialization) is the same bug class.
| Affects | upstream v2 and v3 test suites |
| Status | not fixed here — upstream test code |
data = custom_realloc(...) and mi_heap_new() are both used without a NULL
check, so any allocation failure becomes an opaque segfault far from its cause.
This is what made bug 1 present as a mysterious crash rather than an obvious
out-of-memory.
- Using upstream mimalloc on Windows/MinGW? Bug 1 applies to you and is worth carrying a patch for.
- Using this fork? All of the above are handled — v3 on
main, and the v2 line carries its own variant of the bug 1 fix.
Both leaks passed the entire existing test suite, because every test only asked "did it crash?" and never "did memory stay bounded?".
test/test-degenerate.c closes that gap. It creates and
joins 184 threads and asserts the engine's live threads counter comes back down
and RSS has not climbed. It is verified in both directions — with the fix
reverted it fails with threads.current=184; with the fix in place it reads 1.
A regression test that has never been observed to fail proves nothing.
It also drives patterns the stress tests do not: sawtooth, fragmentation-then-large,
a full size-class sweep with ±1 boundary probes, realloc ping-pong across the
small/large boundary, huge-allocation churn, and degenerate arguments
(zero-size, free(NULL), alignments, SIZE_MAX, calloc overflow).
Every gate below runs on each PR and is a hard failure. Where a gate can have a positive control — a deliberately broken input it must catch — it has one, because a gate that has never been observed to fire proves nothing.
That is not a hypothetical standard. Seven gates in this repository were found to be verifying nothing, each discovered by asking "has this ever actually failed?":
- the arm64 instruction scanner matched nothing at all and reported "clean"
- the memory-gate's leak control existed but was never invoked
- the ASan job's branch filter excluded every branch we work on
- the cross-build pipeline discarded its own diagnostics
MI_TRACK_ASANsilently self-disabled when its header was missingMI_GUARDEDwas documented as default-on in debug builds and had never once been enabled — two independent dead CMake constructs- the fuzz job's "did ASan report this?" check matched libFuzzer's own boilerplate line "Combine libFuzzer with AddressSanitizer…" — so the string proving ASan worked was libFuzzer saying it was not in use
| Gate | What it catches | Positive control |
|---|---|---|
memory-gate (ci/memory_gate.py) |
peak memory or thread-count regressions vs a committed per-platform baseline | builds a copy with an injected leak; the gate must fail — verified at +212% / +98% / +27% on linux/windows/macos |
isa-baseline (ci/check_isa_baseline.py) |
binaries containing instructions above the CPU baseline, which SIGILL on older hardware | builds with MI_OPT_ARCH=ON; the scanner must fire. The parser also self-tests against x86 and arm64 fixtures on every run |
| ctest matrix | correctness on ubuntu / windows-MSVC / windows-MinGW / macos, MI_PPROF on and off, MI_DEBUG_FULL, and shared-library builds on all three of ubuntu, MSVC and MinGW |
— |
| ctest-guarded | the MI_GUARDED guard-page path, run twice: at the default sample rate and again with MIMALLOC_GUARDED_SAMPLE_RATE=1 so every eligible allocation is guarded |
configure step greps the resolved compiler defines for MI_GUARDED=1, since the original bug was the flag never reaching the compiler |
| asan | use-after-free, overflow and leaks under AddressSanitizer | — |
fuzz (test/fuzz/) |
crashes from structured random allocator-API sequences, with ASan as the oracle | builds with a planted use-after-free and requires an anchored (ERROR|SUMMARY): AddressSanitizer: report naming it |
| amalgamation-drift | a C change that never reached the vendored copy the Rust crate compiles — which broke main twice before this gate existed |
— |
| python-lint | the gate scripts themselves — ruff + pyright --strict |
— |
| zero-tracking | correctness and footprint of mi_option_purge_zeroes, reported as paired interleaved A/B medians with the within-arm spread alongside |
— |
Two details worth stating, because both were assumptions that measurement overturned:
- Peak memory is not a low-variance signal. Repeated runs of the same unchanged binary span 6–12% on CI runners. The memory gate therefore compares the minimum of four runs and prints the observed spread every time, warning if it ever approaches the tolerance. A gate that flakes gets ignored, and an ignored gate is worse than none.
- The gate scripts are gating code. Several of the silent failures above were Python
or YAML bugs rather than C bugs — the arm64 instruction scanner matched nothing at all
and reported "clean". Hence
pyright --strictoverci/, with the result schema declared rather than indexed by hope. - Match report headers, not prose. The fuzz control's
grep -qiE "AddressSanitizer"was satisfied by libFuzzer's advice to use AddressSanitizer. Assertions about tool output should anchor on that tool's actual report format (^(==[0-9]+==)?(ERROR|SUMMARY):), never on a keyword that can appear in an explanatory sentence.
Every divergence from upstream mimalloc, with its origin and current upstream status. The point is that you should not have to read git history to answer "is this theirs, ours, or someone else's?" — which matters most when deciding whether to depend on a behaviour.
Total C-core divergence: ~2,340 lines, of which ~1,970 are new files. The patches into upstream's own files come to about 60 lines across 11 files — deliberately small, because every one of them is a line that has to be re-reasoned on each upstream sync.
| Feature | Source | Upstream status | Where |
|---|---|---|---|
| pprof-compatible sampled heap profiler | this fork | not upstream — but see the note below | src/profile.c (893), src/profile-stack.c (185), src/profile-maps.c (172), include/mimalloc/profile.h |
| Memory-events accounting + callbacks | this fork | not upstream | src/memory-events.c (408), include/mimalloc/memory-events.h |
mi_unwrapped_* non-recursive scratch allocator |
this fork | not upstream | src/memory-events.c |
Rust crate + GlobalAlloc, incl. the zeroing-realloc family |
this fork | n/a | rust/mimalloc-pprof/ |
Not the only pprof profiler for mimalloc. Bun's fork built one independently (
src/prof.c), and upstream branchpr-1266carries a third from Datadog — using the same filenames as ours. What distinguishes this one is native Windows support: Bun's stack capture is guarded behind glibc/Apple<execinfo.h>. SeeMIMALLOC_FORKS.md.
| Fix | Source | Upstream status |
|---|---|---|
| MinGW thread-exit cleanup never runs (unbounded leak) | this fork | adopted upstream in 60c4f031, crediting #56 |
…but upstream's copy guards on __GCC__, which no compiler defines, so it never compiles |
this fork | not upstream — one-token fix we carry; reported as microsoft/mimalloc#1349 with a 44× thread-churn measurement |
mi_heap_new / mi_subproc_new do not bootstrap the library |
this fork | not upstream; same class as upstream #1341 |
test-stress.c dereferences unchecked allocations |
this fork | not upstream |
| Seeded sampling was not reproducible (ASLR in the PRNG seed) | this fork | n/a — our code |
| Change | Source | Status |
|---|---|---|
Zero-tracking — zalloc skips its memset after a zeroing purge |
idea from Bun; implementation ours | on main since the v4 line was dissolved (#129), off by default (mi_option_purge_zeroes). −10.8% on the anti-workload on Windows; no effect on Linux; macOS unmeasured |
| Zero the new TLS slots after the slot array grows | code from oven-sh/mimalloc@d078ad06, MIT |
landed in #148. rezalloc preserves the uninitialized slack between the requested size and the bin size, and _mi_thread_local_get validates a slot only by its version lane — so garbage could be returned as a mi_theap_t*. Bun fixed the zeroing; we had separately fixed the array's provenance (#128 B3), which they still lack. Each fork had one half |
| Change | Source | Why not |
|---|---|---|
| Background purge thread | Bun | purge can decommit a page a live sample record still points into — use-after-decommit at dump time, as the default behaviour |
| Hole purging | Bun | ~1000 lines in the file we already patch most; changes what mi_usable_size and our memory-events counters mean |
mi_theap_merge_stats NULL guard |
Bun | already fixed differently upstream (b6dc592b); Bun dropped it too |
| Arena/page-map rollback helper | Bun | already fixed differently upstream (66fd7a99); Bun dropped it too |
MetaSafe liveness bits, MI_MUSL_BUILTIN, Arma 3 defaults |
various | see MIMALLOC_FORKS.md |
Tracks upstream/dev3, pinned at bcee5a88. The pin is bumped deliberately rather than
continuously — see #80 for the method
and what the last bump found.
A hardening pass over v3 (#61) landed the following. Each row says where it came from, because "is this ours, upstream's, or someone else's?" should not require reading git history.
| Change | Source | Why |
|---|---|---|
| Memory + counter regression gate, per-platform baselines | this fork | The two leaks below passed every existing test. Nothing asked whether memory stayed bounded. |
| ISA baseline check (x64 + arm64) | prompted by Debian #1094881 / Fedora #2342055 | Above-baseline instructions SIGILL on older CPUs. Debian and Fedora independently found MI_OPT_ARCH=OFF is a no-op on arm64 — confirmed here. |
| Shared-library CI (ubuntu + win-gnu) | prompted by conda-forge's extern inline patch |
Our single-TU amalgamation hides link errors that only appear in a real DLL/so. Found 4 test targets that broke shared-only builds. |
MI_PROF_CONFIG_OVERRIDE tested on every env-backed field |
this fork | MIMALLOC_* is process-global and other libraries embed mimalloc. This is the documented way to be immune to the ambient environment. |
ruff + pyright --strict over ci/ |
this fork | The gating layer was itself unchecked; two silent gate failures were Python bugs. |
-Wmaybe-uninitialized fix in src/profile.c |
this fork | Noise in every build log is where a real warning hides. |
Not adopted, deliberately: a background purge thread and hole purging (both from
Bun's fork) — the first can decommit a page while a
live sample record still points into it, the second adds ~1000 lines to the file we already
patch most. Two Bun correctness fixes were evaluated and rejected as already fixed
upstream (b6dc592b, 66fd7a99); Bun themselves dropped both in favour of upstream's
versions. Reasoning and per-change ratings are in
MIMALLOC_FORKS.md.
v3 was held to the same bar as v2 before it became the mainline — identical workloads, same machine, Windows/MinGW, 32 threads:
| v3 | v2 | |
|---|---|---|
ctest, Debug and Release, 3 runs each |
13/13 | 9/9 |
MI_PPROF=OFF |
9/9 | 6/6 |
| Rust workspace suite | green | green |
test-stress peak RSS @ 50 iterations |
0.24 GB | 11.98 GB |
test-stress peak RSS @ 100 iterations |
flat | 23.50 GB |
test-stress-heaps @ 25/50/100/200 iterations |
flat ~0.82 GB | test not present |
v3's test set is a strict superset of v2's, adding test-stress-heaps,
test-stress-subprocs, test-profile-race, and test-degenerate.
cmake -S . -B build -DMI_PPROF=ON -DCMAKE_BUILD_TYPE=RelWithDebInfo
cmake --build build --config RelWithDebInfo
cmake --install build --config RelWithDebInfo --prefix /path/to/prefixUse MI_PPROF=OFF to omit the profiler implementation and its allocation hooks.
The public profiler functions remain linkable as no-op stubs, and the
memory-events API remains fully available.
In a CMake consumer, link the mimalloc shared target or the mimalloc-static
static target exactly as with upstream mimalloc:
add_subdirectory(path/to/mimalloc-pprof)
target_link_libraries(my_app PRIVATE mimalloc-static)
Do not link two mimalloc implementations into one process. In particular, a Rust binary using the crate's vendored allocator must not also link the root CMake library.
Beyond mi_realloc, mimalloc provides variants that Rust's GlobalAlloc cannot express
and that are easy to miss:
| Function | What it does |
|---|---|
mi_rezalloc(p, n) |
grow/shrink and zero the newly-exposed tail |
mi_recalloc(p, count, size) |
same, in calloc's element-count form |
mi_rezalloc_aligned, mi_recalloc_aligned |
aligned variants |
mi_expand(p, n) |
grow in place only — returns NULL rather than moving, leaving p valid |
The zeroing forms save a memset you would otherwise write by hand. One subtlety worth
knowing: they zero from the block's old usable size, not from the size you
originally requested. A block requested at 64 bytes may be usable to 80, so growing it
to 70 is served in place with nothing zeroed. If you need a specific range zeroed,
capture mi_usable_size before the call.
All of these are available from Rust as mimalloc_pprof::{rezalloc, recalloc, expand, usable_size}.
The profiler walks your application's frames, so the flags that matter are the ones on your targets — not the ones this library builds itself with.
MI_PPROF=ON adds -fno-omit-frame-pointer to mimalloc's own translation units
(CMakeLists.txt), but that is PRIVATE and does not propagate to consumers. Enabling
the profiler does not make your code unwindable, and the symptom is truncated or
nonsensical stacks rather than an error:
add_subdirectory(path/to/mimalloc-pprof)
target_link_libraries(my_app PRIVATE mimalloc-static)

# Linux/macOS: the profiler walks frame pointers, so your code must keep them.
if(NOT WIN32)
  target_compile_options(my_app PRIVATE -fno-omit-frame-pointer)
endif()
Or from the command line: -fno-omit-frame-pointer (plus -g, or
-DCMAKE_BUILD_TYPE=RelWithDebInfo, so the addresses resolve to names). Apply it to
every library you want to see in a profile, not just the top-level executable — an
optimised dependency built without it terminates the stack at its boundary.
Windows is different, and /Oy- is not the answer. Stack capture there uses the
unwind tables x64 emits regardless of frame-pointer settings; what you need is the
PDB next to the binary at analysis time. Keep it even for release builds — the ZIP
that ships with each GitHub release contains no symbols for your code.
The Rust equivalent is -Cforce-frame-pointers=yes; the two are the
same requirement expressed in each toolchain.
#include <mimalloc.h>
#include <mimalloc/profile.h>

int main(void) {
  if (!mi_prof_start(0)) {  /* 0 uses env/default: about 512 KiB */
    return 1;
  }

  /* Run the workload whose live heap you want to inspect. */
  void* allocation = mi_malloc(1024 * 1024);

  if (!mi_prof_dump("heap.prof")) {
    mi_free(allocation);
    mi_prof_stop();
    return 2;
  }

  mi_free(allocation);
  mi_prof_stop();
  return 0;
}
mi_prof_start_ex provides structured configuration for the sample interval,
sampling seed, cumulative mode, stack depth, profiler-memory budget, and
exit-time dump. The complete versioned API contract is in
include/mimalloc/profile.h.
[dependencies]
mimalloc-pprof = "0.9"          # v3 engine (current)
# mimalloc-pprof = "0.8"        # v2 engine

[profile.release]
debug = "line-tables-only"
strip = false
Or against a checkout:
mimalloc-pprof = { path = "../mimalloc-pprof/rust/mimalloc-pprof" }Install the allocator once, start profiling before the workload, and dump while the allocations of interest are still live:
use mimalloc_pprof::{prof, MiMalloc};
use std::path::Path;

#[global_allocator]
static ALLOCATOR: MiMalloc = MiMalloc;

fn main() -> std::io::Result<()> {
    if !prof::start(0) {
        return Err(std::io::Error::new(
            std::io::ErrorKind::AlreadyExists,
            "heap profiler already active",
        ));
    }

    let retained = vec![0_u8; 1024 * 1024];
    prof::dump_file(Path::new("heap.prof"))?;
    std::hint::black_box(&retained);
    prof::stop();
    Ok(())
}
On v3 (0.9.x), prof::stats() carries the exact allocator counters alongside the
sampled ones:
let s = mimalloc_pprof::prof::stats();
println!(
    "sampled live: {} bytes in {} samples; allocator committed: {}, requested: {}",
    s.live_bytes, s.live_samples, s.heap.committed, s.heap.malloc_requested,
);
On Linux and macOS, retain frame pointers for reliable stack walking. This is the same requirement as the C build flags, expressed for cargo:
# .cargo/config.toml
[build]
rustflags = ["-Cforce-frame-pointers=yes"]
Windows x64 uses unwind information instead; keep the generated PDB for symbolization.
The crate vendors mimalloc as a single amalgamated C translation unit with no
autotools or CMake step, so it builds wherever cc-rs can reach a C compiler,
cross-compiled builds included.
aarch64-pc-windows-msvc needs one adjustment, and build.rs makes it itself.
In plain C mode mimalloc models C11 atomics with a deprecated MSVC
Interlocked wrapper whose _acq/_rel ARM64 intrinsics clang-cl does not
declare, so a cargo-xwin cross build cannot compile it. Since 0.9.3 the
build script compiles that target against clang's C11 stdatomic
implementation instead.
Selecting this inside build.rs is the point. CFLAGS applies to every
cc-rs build script in a build, so a consumer forcing mimalloc's C++ atomics
path from the outside with CFLAGS=-TP also flips the language mode of every
other native dependency in the graph — ring, for one, fails to compile as
C++. No consumer should have to know how this crate selects its atomics.
Measured, so you can decide whether to ship MI_PPROF=ON. Windows/MinGW, Release,
4M alloc/free pairs single-threaded, both arms built from the same commit and run
interleaved, minimum of four runs of three reps each:
| build | ns per allocation | within-arm spread |
|---|---|---|
MI_PPROF=OFF |
11.75 | 4% |
MI_PPROF=ON, profiler stopped |
20.00 | 14% |
About +70% per allocation with the profiler switched off. That is the cost of the
unconditional _mi_prof_on_alloc call on the allocation fast path, which then checks an
atomic flag and returns. Single-threaded on purpose — this is per-allocation instruction
count, not lock contention (contention was a separate defect, fixed in #152).
This is larger than it should be and is a known gap rather than a design choice. Bun's
fork takes a different approach: it leaves the fast path completely untouched and, when
profiling is switched on, poisons pages_free_direct so allocations divert into the
already-cold _mi_malloc_generic, where the sampling check lives. That is strictly
better when disabled, which is the common case for a shipping build. Tracked in #50.
Until then: if allocation throughput matters more to you than being able to turn
profiling on at runtime, build with MI_PPROF=OFF. Enabling the profiler at runtime
costs more again, but the sampling decision itself is now lock-free (#152).
Some libraries statically embed mimalloc (NVIDIA's drivers are the usual example), so a
process can end up with our build and a stock one, each with its own options table.
We evaluated namespacing our additions — MIMALLOC_PPROF_* instead of MIMALLOC_PROF_*
— and decided against it, because it does not address the actual hazard.
Our additions are already inert to a stock mimalloc. mi_option_init looks options up
by name (_mi_getenv("mimalloc_" + option_name)); nothing enumerates the environment.
A stock build never asks for mimalloc_prof_sample_rate or mimalloc_memory_events, so
it does not see them, does not warn, and does not misbehave. Renaming them would prevent
a collision that cannot occur.
The real collision is on upstream's own option names, and it is inherited rather than
introduced by us. MIMALLOC_VERBOSE, MIMALLOC_SHOW_STATS, MIMALLOC_PURGE_DELAY and
friends are read by every mimalloc in the process, so setting one to debug our allocator
also reconfigures the embedded one. Renaming our options does nothing about that — and
we cannot rename upstream's without ceasing to be a drop-in replacement.
So: no namespacing. It would break every 0.9.x user's configuration to solve a problem that does not exist, while leaving the one that does.
What to do if it bites you. There is no per-instance environment scoping in mimalloc.
Configure our instance through the API instead — mi_prof_start_ex, mi_option_set — and
leave the environment alone; API calls affect only the instance you call them on. If you
need the environment for startup-time capture, be aware it is process-wide.
Set these before process launch to capture allocations made during startup,
before main runs:
MIMALLOC_PROF=1 \
MIMALLOC_PROF_DUMP_AT_EXIT=heap.prof \
MIMALLOC_PROF_SAMPLE_INTERVAL=524288 \
./my_app| Setting | Meaning |
|---|---|
MIMALLOC_PROF=1 |
Start the profiler automatically at process start |
MIMALLOC_PROF_DUMP_AT_EXIT=path |
Write a profile at exit |
MIMALLOC_PROF_SAMPLE_INTERVAL=N |
Bytes between samples (default ~512 KiB) |
MIMALLOC_PROF_ACCUM=1 |
Keep cumulative counters until mi_prof_reset |
MIMALLOC_PROF_BT_MAX=32 |
Maximum captured stack depth (compile-time cap 128) |
MIMALLOC_PROF_MAX_BYTES=N |
Bound persistent profiler arena memory |
MIMALLOC_PROF_SEED=N |
Deterministic sampling, for repeatable tests (see the note below) |
MIMALLOC_PROF_DUMP_FORMAT=proto |
Write pprof profile.proto instead of text |
MIMALLOC_PROF_SAMPLE_RATE remains a compatibility alias for
MIMALLOC_PROF_SAMPLE_INTERVAL; when both are set, ..._INTERVAL wins.
What MIMALLOC_PROF_SEED guarantees. Two runs of the same workload with the same
seed sample at the same points, provided the threads are created in the same order —
each thread's stream is derived from the seed and its creation ordinal. It does not make
a workload whose threads race to allocate reproducible, because which thread reaches a
given allocation first is still nondeterministic. Single-threaded and
deterministic-startup workloads are fully repeatable.
Until 0.9.1 this was not true at all: the per-thread stream mixed in the address of the thread's allocator state, which ASLR randomises, so seeded runs differed in every process (#91).
Environment variables are process-global, and mimalloc is often embedded in
libraries you did not choose to load — NVIDIA's display driver ships mimalloc 3.1.6,
for instance. Every MIMALLOC_* variable is therefore seen by every mimalloc instance
in the process.
That is inherent to mimalloc's option mechanism rather than something this fork
introduced: mi_option_init hardcodes the mimalloc_ prefix, and the profiler's
options are registered in mimalloc's own option table, so their env names follow from
that. It applies equally to upstream's MIMALLOC_SHOW_STATS, MIMALLOC_VERBOSE, and
friends. Renaming ours to a private prefix would not fix the shared-namespace problem;
it would only move our share of it, at the cost of the published 0.9.0 API.
If you are embedding this library and need to be immune to the ambient environment,
do not rely on the variable names — use MI_PROF_CONFIG_OVERRIDE:
mi_prof_config_t_decl(cfg);           /* zeroed, with size + version filled in */
cfg.mode = MI_PROF_CONFIG_OVERRIDE;   /* struct wins over env, field by field */
cfg.sample_interval = 2048;
if (!mi_prof_start_ex(&cfg)) return 1;
The default mode, MI_PROF_CONFIG_FALLBACK, is the opposite: env wins and the struct
only fills gaps, so ops can tune a shipped binary without a rebuild. Both directions are
covered by the test suite for every env-backed field, not just some of them.
One asymmetry to know about: because 0/NULL doubles as "field not set", OVERRIDE
cannot force accum off or max_profiler_bytes back to unbudgeted — those fall
through to env-then-default. It can force them on.
v3 exposes per-heap and per-subprocess counters (mi_heap_stats_get,
mi_subproc_stats_get) that v2 had no API for. The profiler surfaces them in two
places:
1. mi_prof_stats_t v3 fields (MI_PROF_STAT_VERSION 3) — heap_committed,
heap_reserved, heap_malloc_requested, heap_pages, heap_pages_abandoned,
heap_count, theap_count, heap_purged. In Rust these are ProfStats::heap,
a HeapStats struct.
2. A comment block in the text dump, after the samples and before
MAPPED_LIBRARIES:. google/pprof's legacy heap parser skips # lines, so
existing tooling reads the profile unchanged:
# mimalloc heap stats
# committed = 3080192
# reserved = 5308416
# malloc_requested = 2097152
# pages = 43
...
Why this matters. Everything else in mi_prof_stats_t is sampled; these
fields are exact. A sampled profile alone cannot tell you whether it
under-counted, but comparing heap_malloc_requested against live_bytes measures
the sampling error directly — which is what makes an assertion on a sampled
profile meaningful in tests and in production monitoring.
mi_prof_stats_get still accepts v1- and v2-sized structs from older callers and
leaves the newer fields untouched, so upgrading the header does not break an
existing binary.
Two counters carry caveats:
heap_malloc_requestedrequiresMI_STAT >= 2. Upstream enables that level by default only for debug builds; a default release build hasMI_STAT == 0and reports 0. Because 0 is also a legitimate value,mi_prof_stats_t.heap_stats_detailed(Rust:HeapStats::detailed) tells you which case you are in, and the dump records# detailed_stats = 0|1so a saved profile is self-describing. Build with-DMI_STAT=2to enable it in release, at some allocation-path cost.theap_countexcludes the main thread's statically-initialized theap, so a single-threaded process reports 0. It also lags thread exit, since v3 reference-counts theaps for cached thread-locals.
include/mimalloc/memory-events.h exposes
opt-in allocation-change counters, callbacks, a best-effort live-allocation
visitor, and raw-OS-layer mi_unwrapped_* functions for instrumentation that must
avoid allocator recursion. It is independent of MI_PPROF and remains
available in an MI_PPROF=OFF build.
Enable tracking before the first allocation when exact lifetime totals matter:
#include <mimalloc/memory-events.h>

mi_memory_tracking_set_enabled(true);

mi_memory_snapshot_t_decl(snapshot);
if (mi_memory_snapshot(&snapshot)) {
  /* snapshot.live_bytes and snapshot.accum_bytes are now available */
}
Alternatively set MIMALLOC_MEMORY_EVENTS=1 before launch. Enabling tracking
later does not reconstruct allocations made while it was disabled. Callback
reentrancy, pointer lifetime, and live-visitor restrictions are documented in the
header.
mimalloc-pprof is continuously benchmarked against upstream mimalloc, TCMalloc, and jemalloc on a dedicated Linux x86-64 runner. Every result is GitHub-hosted and informational — no self-hosted hardware, no hand-picked runs, no unpublished baselines.
| Resource | Description |
|---|---|
| Benchmark dashboard | Live per-scenario throughput, paired statistical effects, and full allocator provenance |
benchmark-stats branch |
Raw sealed site artifacts (history, manifests, digests) |
latest.json |
Machine-readable publication envelope for the most recent headline run |
- 4 allocators — mimalloc-pprof, upstream mimalloc (same
dev3base), TCMalloc, and jemalloc — pinned to immutable commits with SHA-256-verified source archives. - Paired balanced blocks — every block runs all four allocators in randomized order under one workload seed; ≥15 complete blocks per headline cell.
- Type-7 quantile bootstrap — 10,000 resamples, splitmix64-rejection PRNG, percentile-block confidence intervals at 95%. Paired effects are expressed relative to upstream mimalloc.
- No profiling during measurement —
MIMALLOC_PROF=0andMIMALLOC_MEMORY_EVENTS=0are set on every child process; the allocator runs in its natural configuration. - Deterministic reproducibility — every raw sample carries its exact command line and workload seed; the published site manifest carries a detached SHA-256 digest of every file.
Full protocol details, JSON schemas, and reproduction commands are in
rust/benchmark-suite/.
Per-scenario throughput and the compatible history for the current comparison key are rendered live on the dashboard — with full per-scenario tables and paired effects expressed relative to upstream mimalloc:
The raw sealed artifacts remain available on the
benchmark-stats branch.
How each allocator's aggregate throughput moves as worker threads go from 1 to 4 to 16, for four different allocation patterns. Each pattern is a seeded random operation stream — every operation, size, and slot is drawn from a splitmix64 chain that never observes allocator behavior — so all four allocators replay one identical stream inside each paired block.
Coverage mode: reduced statistical rigor (3 blocks per cell). These panels deliberately trade statistical rigor for thread coverage. They carry no confidence intervals and no noise gating; read them for shape, not for headline-grade differences. The runner allows 4 logical CPUs, so the 16-thread point is 4× oversubscribed and describes contention, not core scaling — it is shaded on every chart.
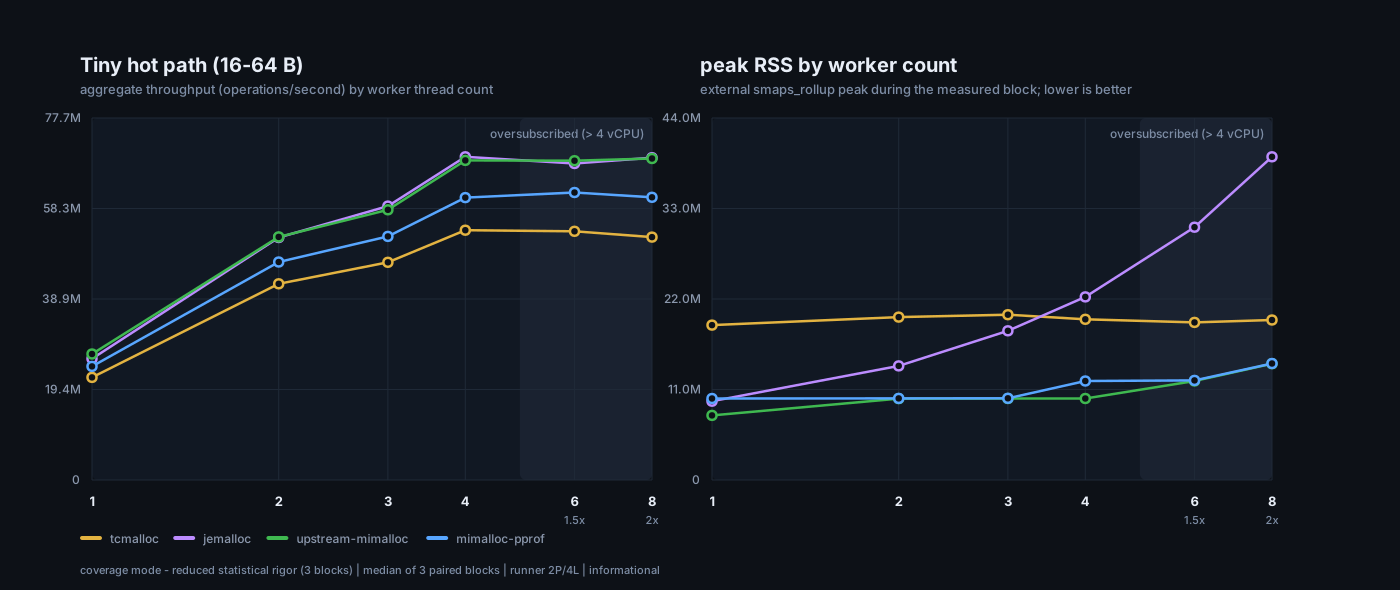
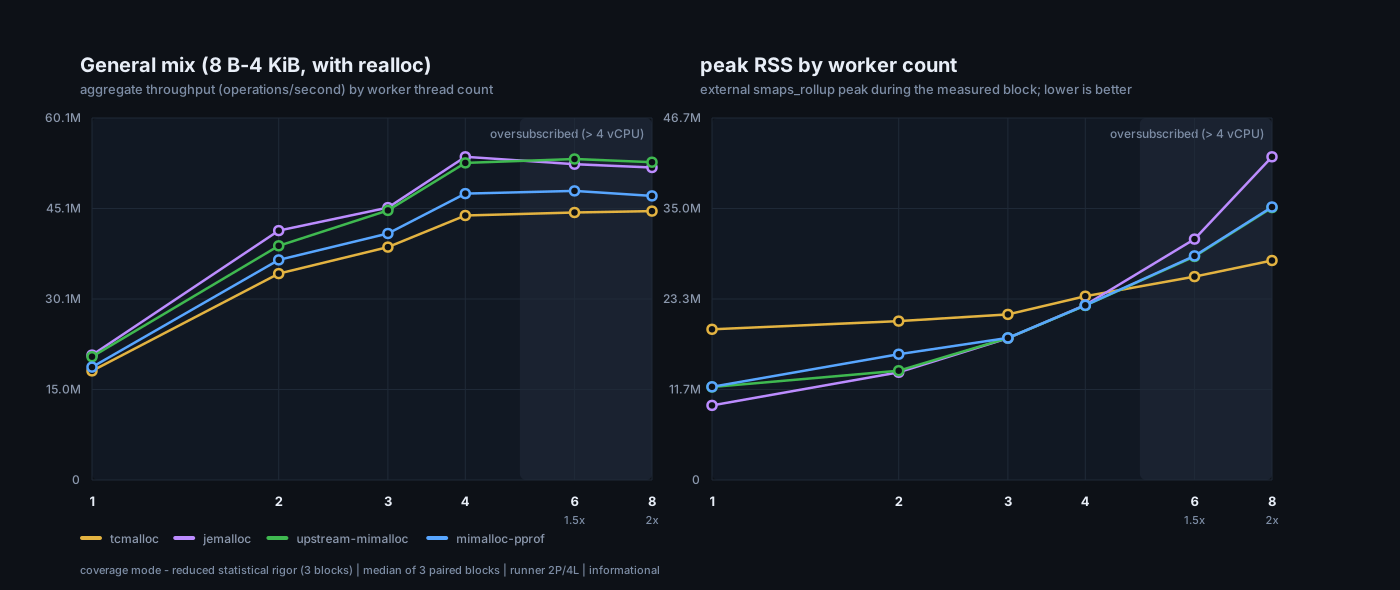
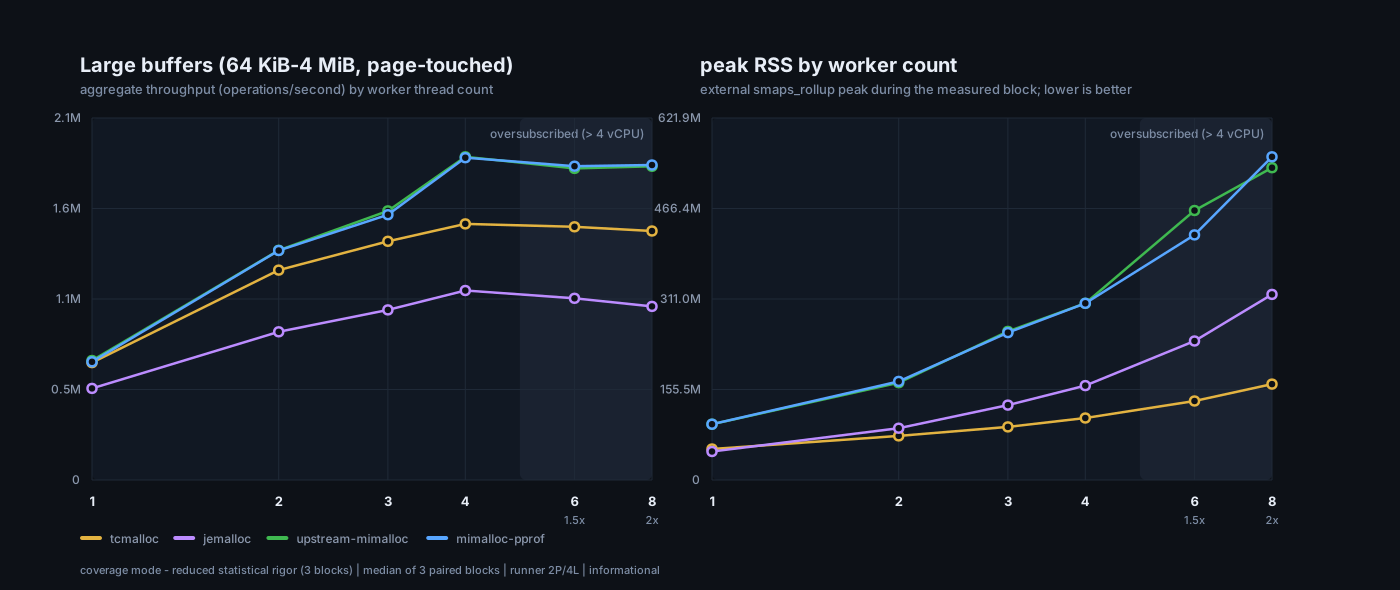
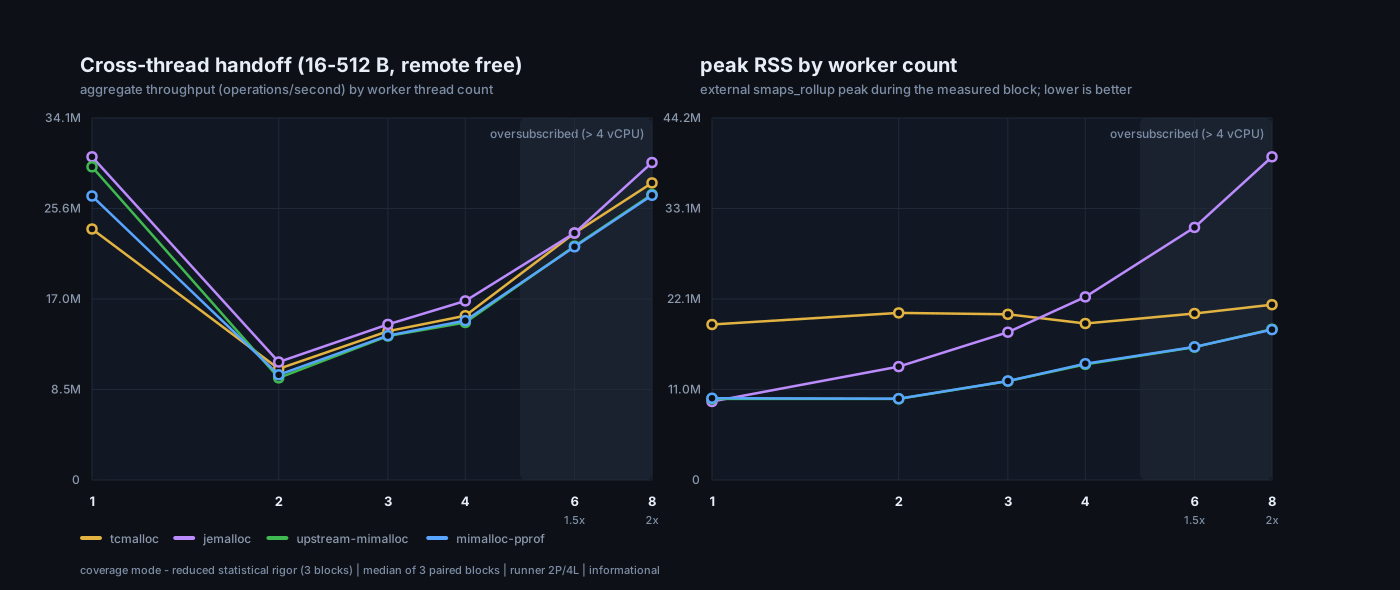
| Pattern | Sizes | What it stresses |
|---|---|---|
| Tiny hot path | 16–64 B | small-object fast path, high alloc/free rate, small live set |
| General mix | 8 B–4 KiB log-uniform | everyday mix including realloc, medium live set |
| Large buffers | 64 KiB–4 MiB | large allocations with one-byte-per-page touching |
| Cross-thread handoff | 16–512 B | remote-free pressure; blocks are freed by another worker |
Protocol throughput-scaling-sparse-v1, published weekly. Full per-cell
tables, min/max spreads, and the metric comparison key are on the
dashboard.
The following metrics are tracked in the dashboard as explicitly pending placeholder panels until their measurement protocols land:
| Metric | Phase issue |
|---|---|
| Pprof compilation and runtime tax | #187 |
Memory (#184), honest transaction latency (#185), and thread scaling (#203) have landed; their panels populate on each metric's next scheduled run. The memory section renders four views over the same sealed envelope (#211): sampled-peak RSS bars normalized to upstream mimalloc (1.0 = upstream, matching the throughput panel), a fragmentation-proxy panel with its own 1.0 reference line, an RSS-over-time timeline with the workload-drained marker and the 100 ms / 1 s / 5 s return-to-OS points annotated, and a speed–memory Pareto scatter (upper-left is better).
When changing or embedding this fork, preserve all of the following:
- Profiler-internal allocations must use the raw OS-layer arena
(
_mi_os_alloc) — nevermi_malloc, C++new, or RustGlobalAlloc. - Every new C source file must be added to the CMake source list and to
src/static.c.src/profile.cstays compiled to provide the OFF stubs and gates its implementation internally; profiler helper files and engine hook call sites must be guarded byMI_PPROF. MI_PPROF=OFFmust remove the profiler hooks and preserve upstream allocator behavior when memory-events tracking remains runtime-disabled. The memory-events API, hooks, and tests remain available in the OFF build.mi_prof_config_t,mi_prof_stats_t, andmi_memory_snapshot_tstay size/version tagged and must be extended compatibly. Other public structs and signatures must not change incompatibly.- Validate C changes on Ubuntu, Windows MSVC, Windows MinGW, and macOS with
MI_PPROF=ON, plus anMI_PPROF=OFFbuild and the Rust workspace. - Never mix root C-core paths and
rust/paths in one commit — it keeps the C changes cherry-pickable upstream.
The Rust package compiles
rust/mimalloc-pprof/vendor/mimalloc-pprof-amalgamated.c, not the root src/
tree. After an intentional C-core change, regenerate and validate it in a separate
Rust-only commit:
cd rust
soldr cargo run -p xtask -- amalgamate-c
soldr cargo run -p xtask -- amalgamate-h
soldr cargo run -p xtask -- check
soldr cargo test --workspace --locked.
|-- include/ src/ test/ CMakeLists.txt # mimalloc v3 C core and profiler
|-- README.md # this file
|-- readme-upstream.md # upstream mimalloc documentation
`-- rust/
|-- mimalloc-pprof/ # allocator crate, safe API, raw FFI
| `-- vendor/ # generated single-file C snapshot
`-- xtask/ # vendored-source regeneration checks
The repository root is mimalloc and retains upstream git history. The
readme-upstream.md rename avoids a Windows case collision with this file.
For upstream mimalloc build modes, overrides, options, and platform notes, see readme-upstream.md. For the fast local development loop, see docs/dev-loop.md. The fixes prepared for submission back to microsoft/mimalloc, with their validation evidence, are in docs/upstreaming.md. Design history and milestone decisions are in issue #2; the survey of other mimalloc v3 forks is in issue #50.
- microsoft/mimalloc, by Daan Leijen (MIT).
- microsoft/mimalloc#1266, the sampled-allocation-hook design this fork builds on.
- gperftools, whose
heap_v2format is accepted by google/pprof.
MIT, the same as upstream. See LICENSE.