
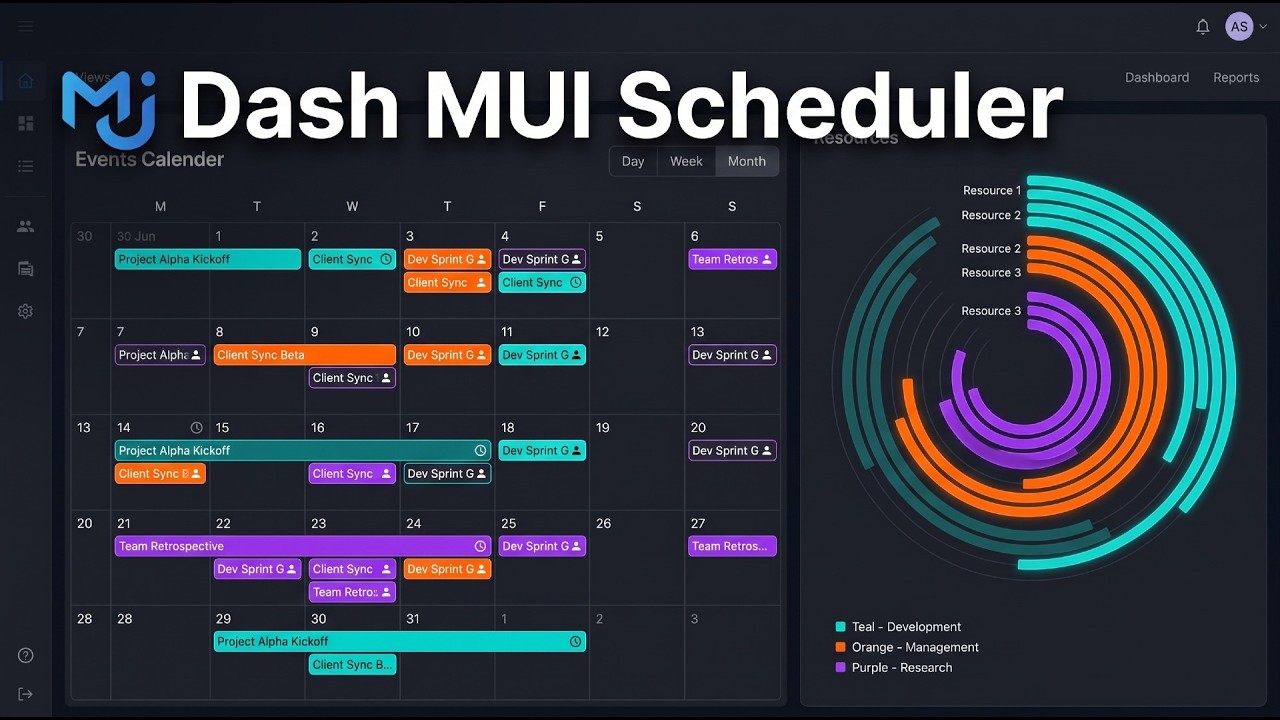
Event calendar, resource timeline & radial chart components for Plotly Dash, wrapping the MUI X Scheduler.
Drag & drop scheduling · recurrence · resources · timezones · automatic dark mode · full Dash callback interoperability.



Documentation · Discord · YouTube · GitHub

Maintained by Pip Install Python LLC.
dash-mui-scheduler wraps the MUI X Scheduler and the MUI X Premium radial charts as a Plotly Dash component library. Build event calendars, Gantt-style resource timelines, and polar charts in pure Python — events cross the Dash ↔ Python boundary as plain dictionaries with ISO-string dates, and every user interaction (create / move / resize / edit / delete) round-trips straight back into your callbacks.
- Event calendar — day / week / month / agenda views, drag-and-drop, resizing, an editing dialog, and a resource side panel
- Recurring events (Premium) — RFC 5545
rrulestrings with per-occurrence exceptions - Resource timeline (Premium) — resource-row Gantt view across
time/days/weeks/months/yearszoom presets - Radial charts (Premium, preview) — polar line/area and bar charts for periodic data
- Plain-dict data boundary —
eventsis both input and output;lastActiontells you exactly what the user changed - Automatic dark mode — follows the surrounding Dash Mantine Components color scheme
- Dash 4.2+ compatible (works on Dash ≥ 2.11)
⚠️ The upstream MUI X Scheduler is in beta (@mui/x-scheduler@9.0.0-beta.0, pinned exactly). This wrapper's API is stable per release, but the upstream API may change before MUI's stable cut.
pip install dash-mui-schedulerimport dash
from dash import Dash, html, Input, Output, callback
import dash_mui_scheduler as dms
app = Dash(__name__)
events = [
{"id": "1", "title": "Team Meeting", "start": "2024-01-15T10:00:00", "end": "2024-01-15T11:00:00", "color": "blue"},
{"id": "2", "title": "Project Review", "start": "2024-01-16T14:00:00", "end": "2024-01-16T15:30:00", "color": "purple"},
{"id": "3", "title": "Client Call", "start": "2024-01-17T09:00:00", "end": "2024-01-17T10:00:00", "color": "green"},
]
app.layout = html.Div(
dms.EventCalendar(id="cal", events=events, defaultVisibleDate="2024-01-15", height=600),
style={"maxWidth": 1000, "margin": "2rem auto"},
)
@callback(Output("cal", "events"), Input("cal", "lastAction"), prevent_initial_call=True)
def on_change(last_action):
print("user did:", last_action) # {'type': 'move', 'event': {...}, 'event_timestamp': ...}
return dash.no_update
if __name__ == "__main__":
app.run(debug=True)Full documentation, with a live, editable demo and source for every example:
Part of the open-source component index maintained by Pip Install Python LLC at 2plot.dev.
You can also run the docs site locally — it is a markdown-driven Dash app served by run.py:
pip install -r requirements.txt
pip install --no-deps markdown2dash==0.1.2   # its gunicorn<22 pin conflicts with our >=23 floor
pip install -e .          # install the built components
python run.py             # open http://localhost:8560
Pages cover Quickstart, the Event Calendar, a Playground, Events, Resources, Views, Navigation,
Responsive behavior, Drag & Resize, Editing, Preferences, Recurrence (Premium), the Event Timeline
(Premium), Localization & Timezones, and the three radial chart pages — each with live demos, the
matching source, and an auto-generated prop table. The app supports Dash 4.1+ pluggable backends via
DASH_BACKEND=flask|fastapi.
| Component | Plan | What it is |
|---|---|---|
EventCalendar |
Community (MIT) | Day / week / month / agenda calendar with drag-and-drop, resizing, resources, and an editing dialog. No license key. |
EventCalendarPremium |
Premium | The calendar plus the recurrence engine (RRULE events + exception dates). |
EventTimeline |
Premium | A resource-row, Gantt-style timeline across configurable zoom presets. |
RadialLineChart |
Premium (preview) | Polar line/area charts (@mui/x-charts-premium) for trends along periodic values. |
RadialBarChart |
Premium (preview) | Polar bar charts for comparing values along periodic categories. |
All five load from a single bundled JS file — no extra external_scripts, CSS, or React setup.
The Premium components wrap @mui/x-scheduler-premium (scheduler) and @mui/x-charts-premium
(radial charts); without a valid MUI X Premium license key they render a watermark. Both share the
same @mui/x-license@9 singleton, so a single key covers everything — pass it from the
environment, never hard-coded:
import os
import dash_mui_scheduler as dms

dms.EventTimeline(id="tl", licenseKey=os.environ["MUI_X_LICENSE_KEY"], ...)
The Dash wrapper code in this package is MIT-licensed; the underlying MUI X Premium libraries are
not. The radial charts are Unstable_ previews — production-ready, but their API may shift.
eventsis a list of dicts and is both an input and an output. Seed it with your data; the component writes the full new array back whenever the user creates, moves, resizes, edits, or deletes an event.- Event dicts need
id,title,start,end; optional keys includecolor,resource,allDay,description,readOnly, and (Premium calendar)rrule/exDates. - Dates are ISO strings (
"2024-01-15T10:00:00", or"...Z"for UTC). No Pythondatetimeobjects cross the boundary. lastAction(output) tells you exactly what changed —{"type": "create" | "update" | "delete" | "move" | "resize", "event": {…}, "event_timestamp": …}.- Controlled + uncontrolled pairs — stateful concepts (
view,visibleDate,preset,preferences,visibleResources) each come as a controlled prop plus adefaultXuncontrolled variant, and are written back on change.
import os
import dash_mui_scheduler as dms

dms.EventCalendarPremium(
    id="cal",
    licenseKey=os.environ["MUI_X_LICENSE_KEY"],
    events=[{
        "id": "1", "title": "Standup",
        "start": "2024-01-15T09:00:00", "end": "2024-01-15T09:15:00",
        "rrule": "FREQ=WEEKLY;BYDAY=MO,TU,WE,TH,FR",
        "exDates": ["2024-01-17T09:00:00"],
    }],
    defaultVisibleDate="2024-01-15",
)
Dragging a single occurrence prompts the user for "this event" vs "all events"; the outcome lands
in events / lastAction like any other edit.
Row-oriented dataset + series referencing columns by dataKey. rotationAxis is the angular
(x-like) axis, radiusAxis the radial (y-like) one:
import os
import dash_mui_scheduler as dms

dms.RadialLineChart(
    id="polar",
    height=400,
    licenseKey=os.environ.get("MUI_X_LICENSE_KEY", ""),
    dataset=[{"month": "Jan", "london": 49}, {"month": "Feb", "london": 38}],  # ...
    series=[{"dataKey": "london", "label": "London (mm)", "curve": "natural", "showMark": True}],
    rotationAxis=[{"scaleType": "point", "dataKey": "month", "disableLine": True}],
    radiusAxis=[{"disableLine": True}],
    grid={"rotation": True, "radius": True},
)
Axis and item clicks surface through the clickData output for drill-down callbacks.
| Prop | Type | Description |
|---|---|---|
events |
list | Event dicts — input and output |
lastAction |
output | {type, event, event_timestamp} for the most recent user edit |
resources |
list | [{"id", "name", "eventColor"}, ...]; events point at one via "resource" |
views / view / defaultView |
list / str | Calendar views: day, week, month, agenda |
preset / presets |
str / list | Timeline zoom: time, days, weeks, months, years |
visibleDate / defaultVisibleDate |
str | ISO date driving the visible range (controlled / uncontrolled) |
areEventsDraggable / areEventsResizable |
bool | Interaction switches (readOnly kills all editing) |
eventCreation |
bool / dict | Enable creation; dict sets interaction + default duration |
displayTimezone |
str | IANA timezone name — shifts display, not data |
preferences / preferencesMenuConfig |
dict | am/pm, week start, weekends, side panel, … |
localeText |
dict | Translation string overrides |
height / sx / className |
— | Sizing and MUI system styling |
The full, auto-generated prop tables are on each component's documentation page.
# Install dependencies
npm install                 # @mui/x-scheduler + build toolchain
pip install -r requirements.txt
pip install --no-deps markdown2dash==0.1.2   # see requirements.txt for why

# Build the JS bundle + regenerate the Python wrappers
npm run build               # webpack bundle + dash-generate-components → dash_mui_scheduler/*.py
python _validate_init.py

# Standalone smoke test
python usage.py             # http://localhost:8051

# Build a distribution
python -m build
The React components in src/lib/ are the source of truth; the Python package in
dash_mui_scheduler/ is auto-generated from their PropTypes by dash-generate-components. The
built bundle and generated wrappers are committed, so pip install -e . works without npm.
setup.py reads the version from package.json — keep them in sync.
- Python >= 3.8
- Dash >= 2.11 (developed against Dash 4.2)
- dash-mantine-components (for the docs site and examples)
- Node.js >= 16 (for development / rebuilding the JS bundle)
Come build with us:
- 💬 Discord — discord.gg/WEnZR35mrK
▶️ YouTube — @2plotai- 🐛 Issues — github.com/pip-install-python/dash-mui-scheduler/issues
dash-mui-scheduler is one of several tools built and maintained by Pip Install Python LLC:
| Project | What it is |
|---|---|
| 📚 2plot.dev | Open-source component index for the Python & Dash ecosystem — every library in the network |
| 🔀 PiratesBargain.com | E-commerce / digital Commerce |
| 🧠 ai-agent.buzz | Infinite AI canvas |
| 🎬 2plot.media | Videography application |
MIT — see LICENSE for the Dash wrapper code in this package. The wrapped
@mui/x-scheduler (Community) is MIT; @mui/x-scheduler-premium and @mui/x-charts-premium
require a commercial MUI X Premium license to use without a watermark. Built by
Pip Install Python LLC to bridge MUI components into the Dash framework.