



Python implementation of the CBAS algorithm (Choice-Wide Behavioral Association Study) for identifying behavioral sequences that differ significantly between experimental groups or correlate with a continuous measure.
Uses Romano-Wolf step-down for multiple comparison correction and k-FWER iteration for false discovery proportion control.
Reference: Kastner et al., "Choice-Wide Behavioral Association Study" Nature Communications (2026)
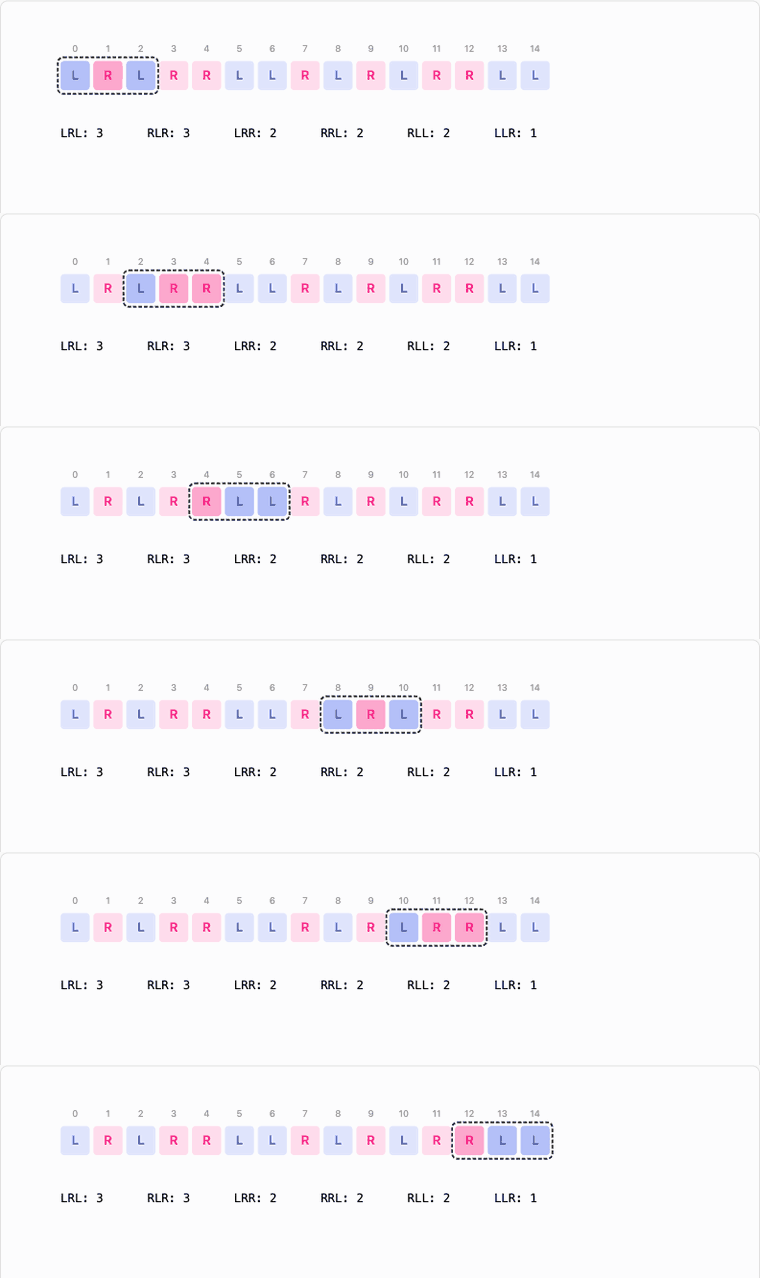
A sliding window walks each subject's choice stream and counts every subsequence up to length seq_len_max. Each unique sequence becomes one column of a subject-by-sequence count matrix, and one hypothesis test.
Testing thousands of sequences needs multiple-comparison correction, but Bonferroni's single fixed threshold is far too strict here. Romano-Wolf step-down instead recomputes the threshold from the bootstrap null after every rejection, over only the sequences that remain. Additionally, Romano-Wolf takes into account the correlational structure of the data, providing more power in the face of correlations between the different sequences. The bar drops as strong effects are peeled off, so moderate effects can still clear it:
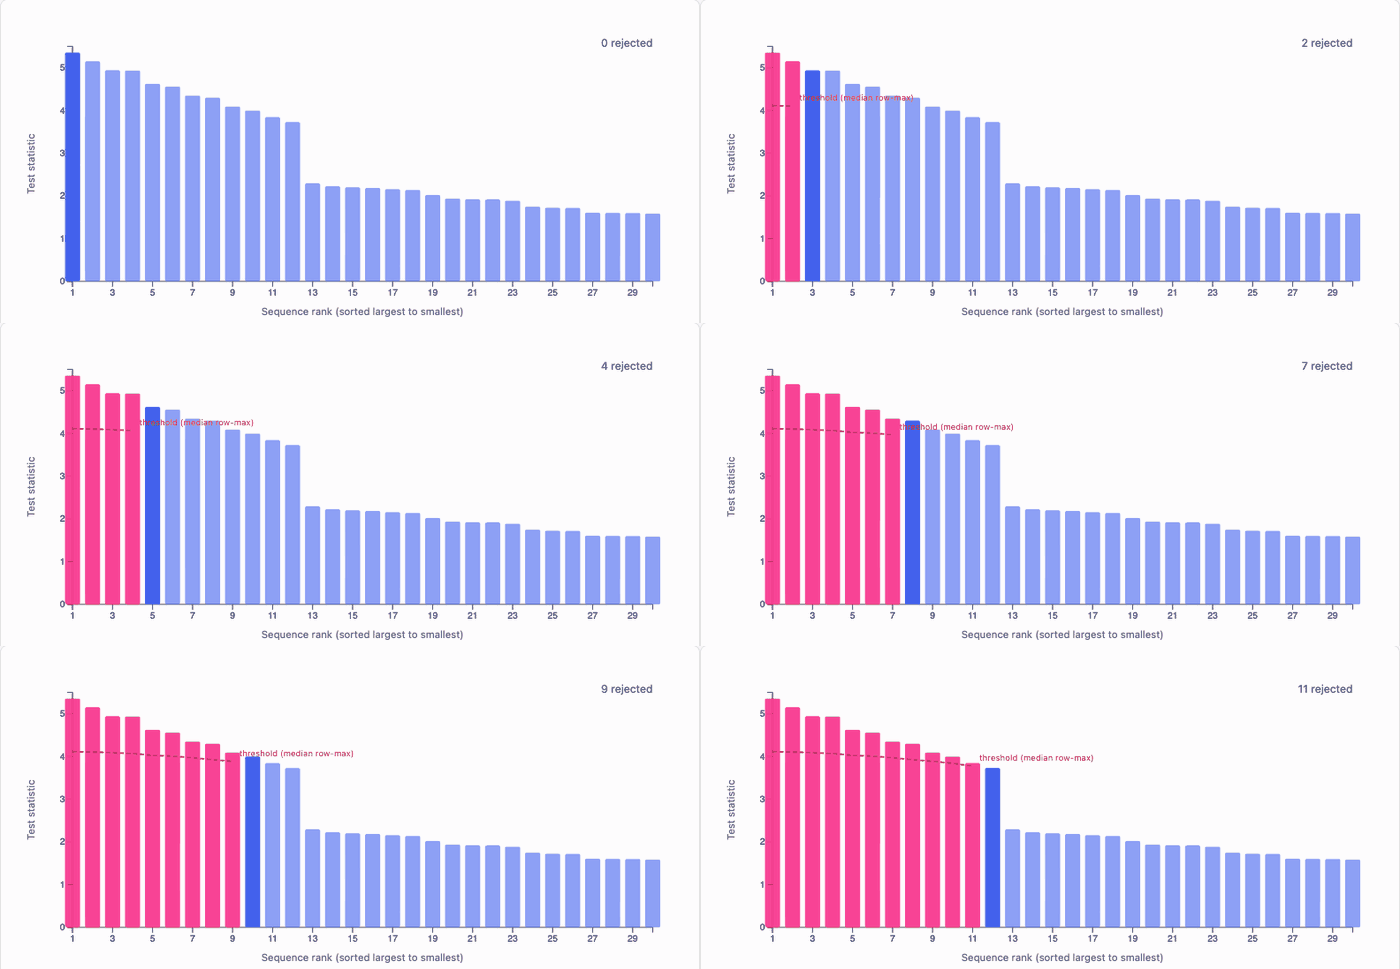
k-FWER iteration then relaxes from familywise error control (i.e. shooting for "no false positives") to false discovery control, enabling "at most k false positives", raising k until the false discovery proportion is bounded by gamma.
Both animations are interactive in the walkthrough, which builds up the whole algorithm step by step.
pip install pycbasFor the interactive GUI:
pip install 'pycbas[gui]'
pycbas gui
Load data, confirm the auto-detected mode, set parameters, run, and explore results — no code required.
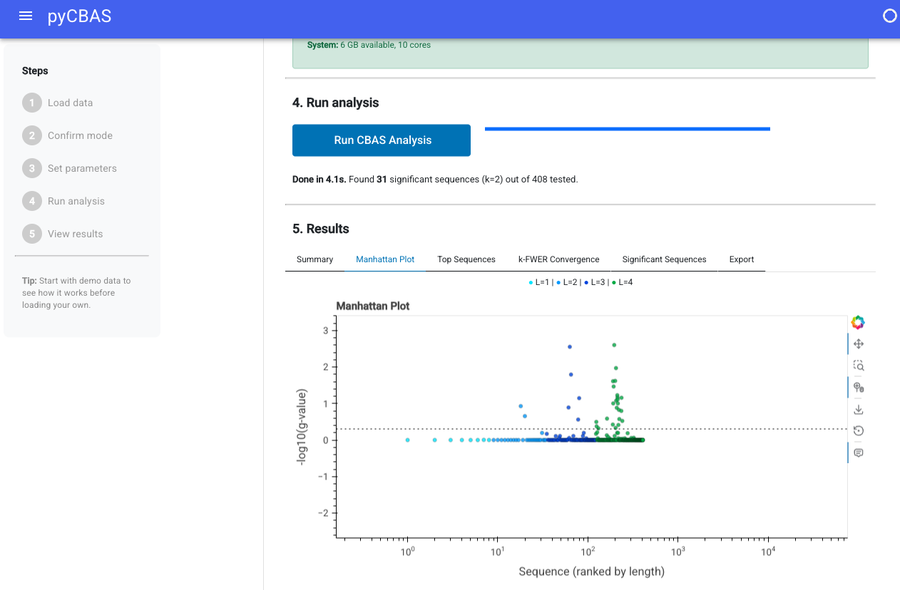
See the GUI documentation for details.
We recommend installing in a dedicated environment (conda, mamba, or pixi) rather than your base environment.
git clone https://github.com/droumis/pycbas.git
cd pycbas

# option 1: pixi (handles everything)
pixi install

# option 2: conda/mamba + pip
conda create -n pycbas python=3.11
conda activate pycbas
pip install -e '.[dev]'
With pixi there is no separate install step for the common tasks; each one installs the package into the environment first:
pixi run gui      # launch the GUI, equivalent to `pycbas gui`
pixi run test     # run the test suite
The pixi environment currently resolves for osx-arm64 only, so contributors on
other platforms should use option 2.
from pycbas import CBASParams, load_subject_data, run_cbas_comparative

subjects_data = [load_subject_data(f) for f in data_files]
group_labels = [0, 0, 0, 1, 1, 1]

params = CBASParams(
    num_arms=6,
    seq_len_max=6,
    criterion=800,
    resample_number=10000,
)

# `contingency` selects trials by the contingency column and defaults to 2. Pass the
# value your data uses, or None for all trials; a value matching no trials counts no
# sequences and reports nothing significant.
result = run_cbas_comparative(subjects_data, group_labels, params, contingency=2)
print(f"{result.n_significant} significant sequences (k={result.k_final})")When subjects run more than one task contingency, each becomes its own set of hypotheses and the multiplicity correction runs over all of them together, so the same arm sequence under two contingencies is two hypotheses.
from pycbas import load_cohort_with_contingencies, run_cbas_multicontingency

records, info = load_cohort_with_contingencies("path/to/cohort")
result = run_cbas_multicontingency(records, group_labels, params, blocks=[1, 2, 3])
result.sequences is then keyed by (block, sequence). Counting several
contingencies multiplies the hypothesis space, so check estimate_resources before
a long run.
from pycbas import run_cbas_correlative

result = run_cbas_correlative(subjects_data, cbit_scores, params)from pycbas import estimate_resources, print_resource_estimate
est = estimate_resources(num_arms=12, seq_len_max=8, n_observed=5000)
print_resource_estimate(est)| Parameter | Default | Description |
|---|---|---|
num_arms |
6 | Number of base symbols (choices) |
seq_len_max |
6 | Maximum sequence length L |
criterion |
800 | Number of trials used per subject |
resample_number |
10,000 | Bootstrap resamples M |
alpha |
0.5 | Significance threshold for FDP control |
gamma |
0.05 | FDP tolerance |
centering |
False | Center bootstrap null (False matches the Igor reference) |
criterion_order |
0 | What criterion counts: 0 trials, 1 rewards, k runs of k rewarded choices |
criterion and criterion_order work together. At order 0 the criterion is a trial
index. At order 1 it is a number of rewarded trials, and at order k a number of runs
of k consecutive rewarded choices, so each subject's stream is truncated where it
reaches that level of performance rather than at a fixed length. Subjects who never
reach it keep all their data, which means the weakest subjects can contribute the
most; subject_criteria reports who fell short.
These are arguments to the pipeline functions rather than fields of CBASParams:
| Argument | Default | Description |
|---|---|---|
contingency |
2 | Only trials whose contingency column equals this are used. None uses all trials |
encode_reward |
False | Encode reward into the symbol alphabet, doubling it |
block_aware |
False | Prevent sequences from spanning block/session boundaries |
chunked |
True | Generate the bootstrap null in row-chunks to reduce peak memory |
| Dataset | Subjects | Sequences | Time | Peak RAM |
|---|---|---|---|---|
| Flies (2-arm, L=10) | 1,566 | 2,046 | ~21s | ~560 MB |
| Humans (6-arm, L=4) | 1,413 | 408 | ~3s | ~155 MB |
| Rats (6-arm, L=6) | 105 | 16,378 | ~12s | ~3.6 GB |
Timings on Apple M-series. The chunked pipeline (chunked=True, default) trades roughly 30% more time for roughly half the peak memory. Bootstrap and step-down are parallelized via numba. Set NUMBA_DISABLE_JIT=1 to disable for debugging.
Exact match with the original Igor implementation on flies (1,605/2,046, k=81) and humans (31/408, k=2). Test statistics match to floating-point precision. Rats (105 subjects, block_aware=True): 572/16,378 significant (k=29), exact match with the Igor reference implementation. Test statistics agree within 1e-6 on all 16,376 overlapping sequences.
See results/validation_summary.md for details, or per-dataset reports:
Full docs at droumis.github.io/pycbas
- User Guide - data format, parameter selection, working with results
- Algorithm - the step-down and k-FWER procedure in detail
- API Reference - all public functions and classes
pixi install          # set up environment
pixi run test         # run tests
pixi run flies        # run fly analysis (paper params)
pixi run human        # run human analysis
pixi run rats # run rat analysisMIT