You signed in with another tab or window. Reload to refresh your session.You signed out in another tab or window. Reload to refresh your session.You switched accounts on another tab or window. Reload to refresh your session.Dismiss alert
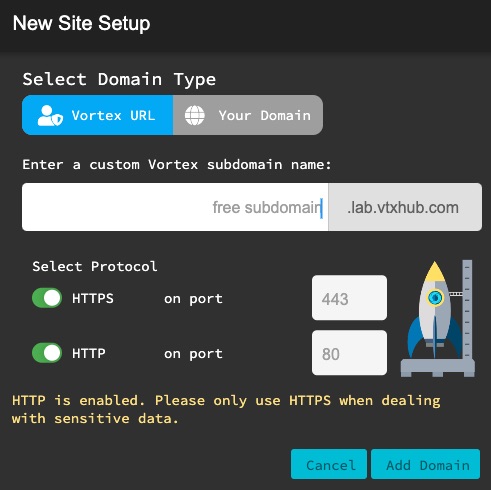
Tunnels allow a dev to easily bypass NAT and firewall restrictions... but what is the tradeoff? Anything behind the firewall is now exposed to the internet
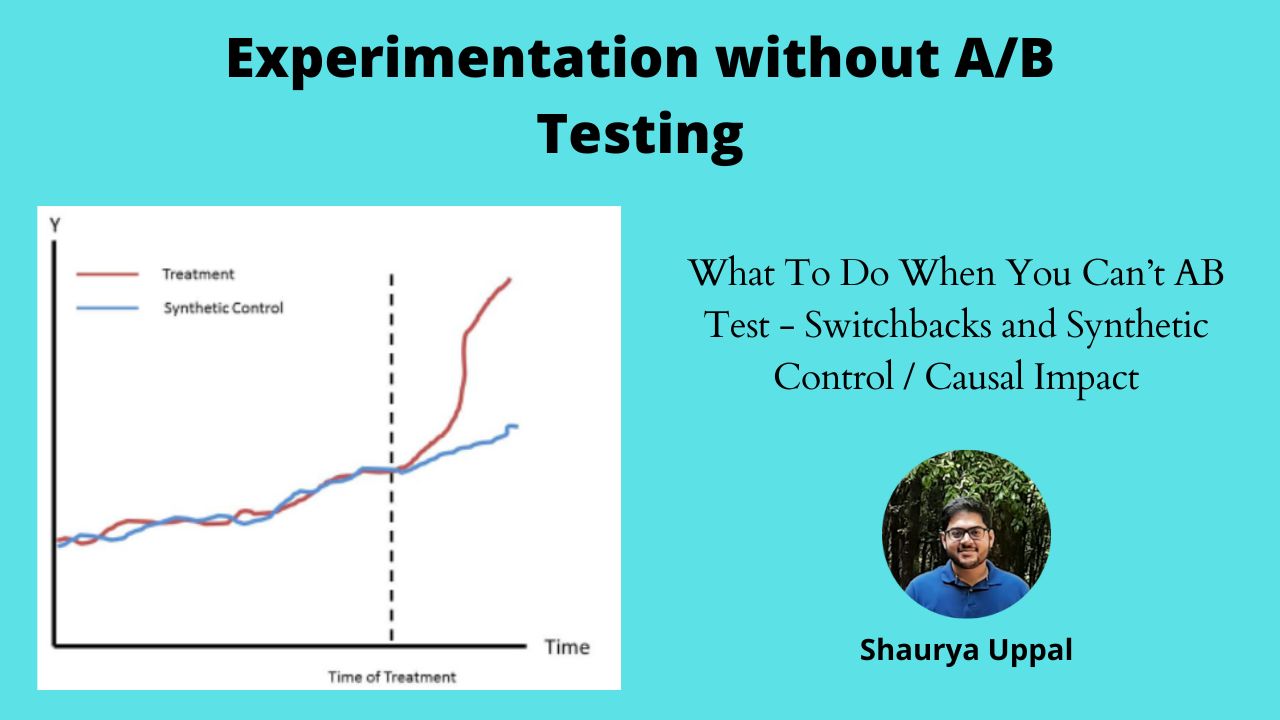
The stability score in particular has made it possible for their team to measure their application’s stability & maintain their team’s error budget of 1% error.
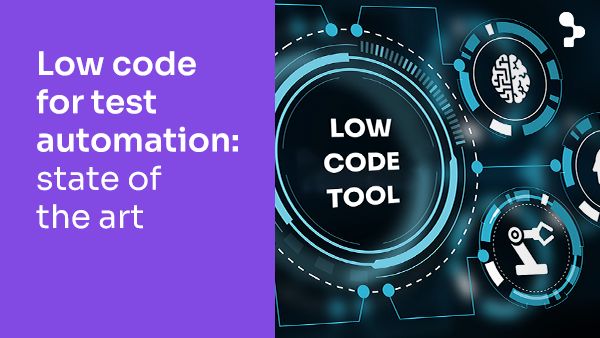
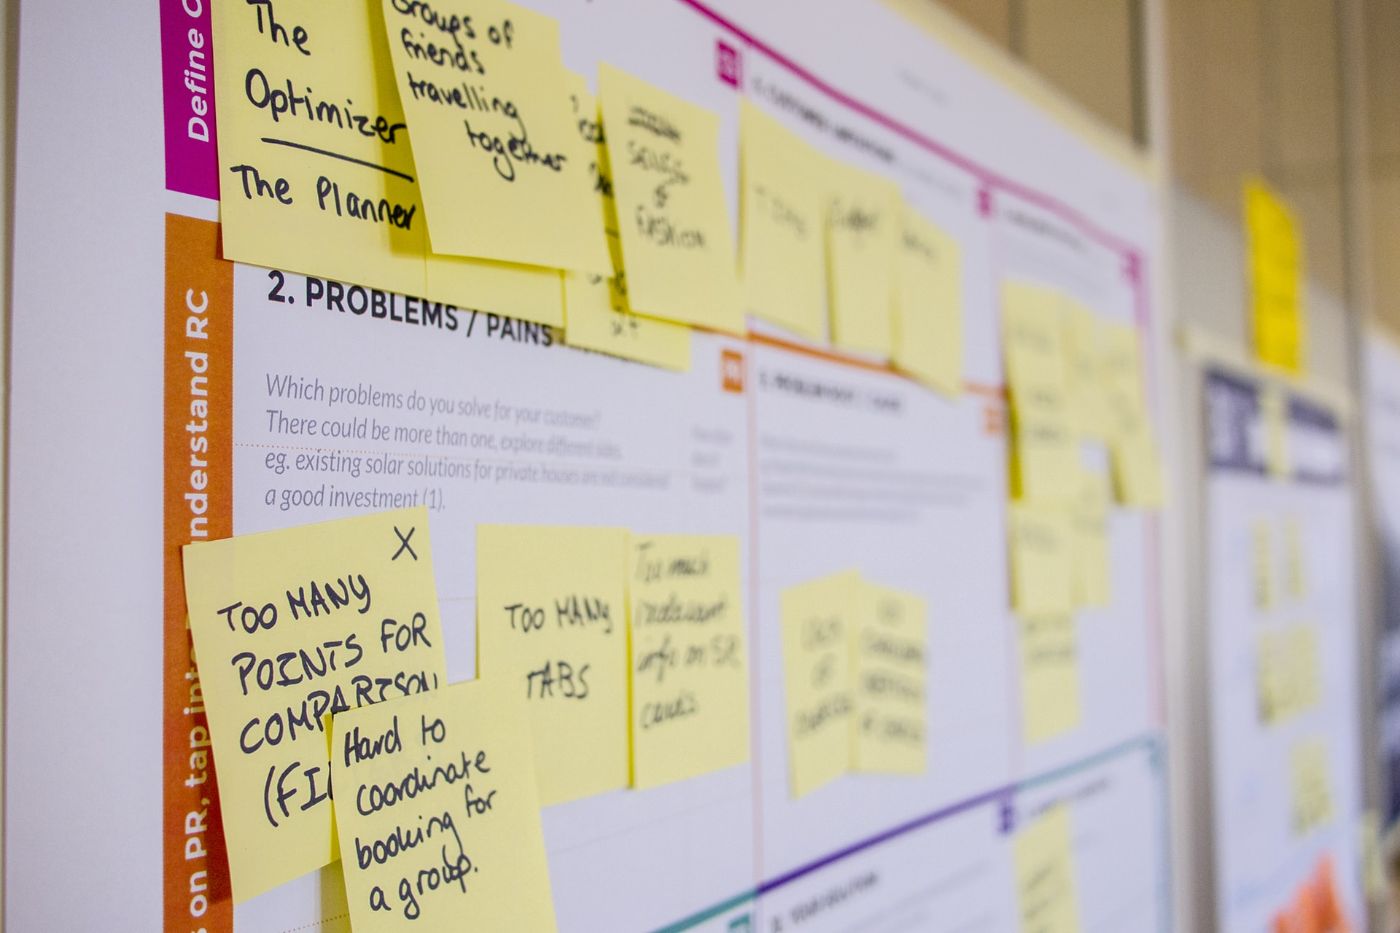
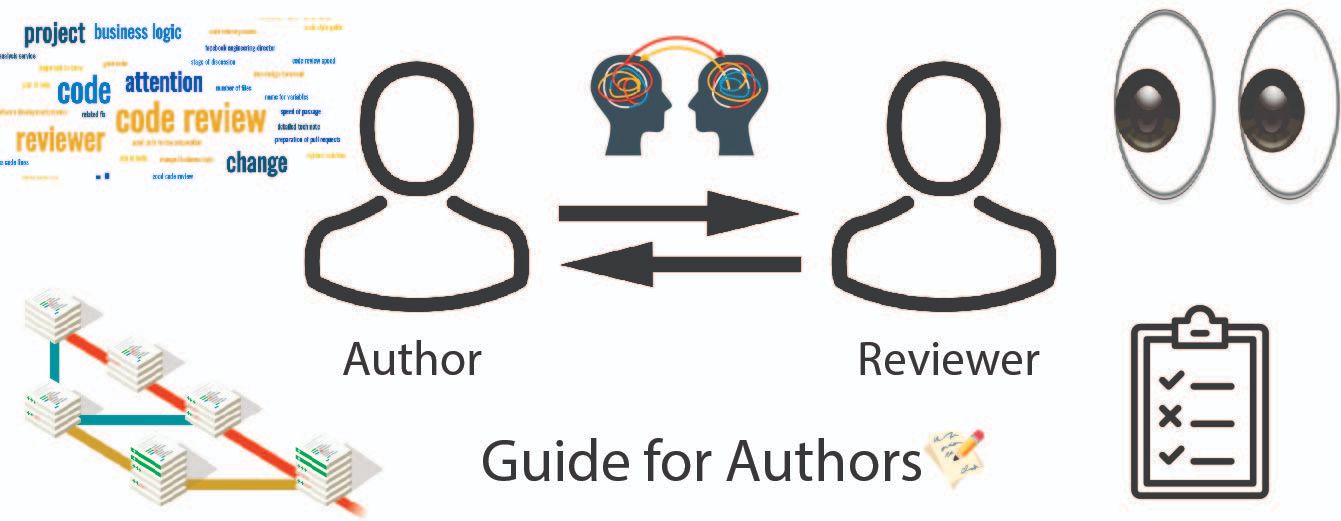
Want to improve your software quality engineering processes but don't know where to start? This software testing maturity model and assessment may help!
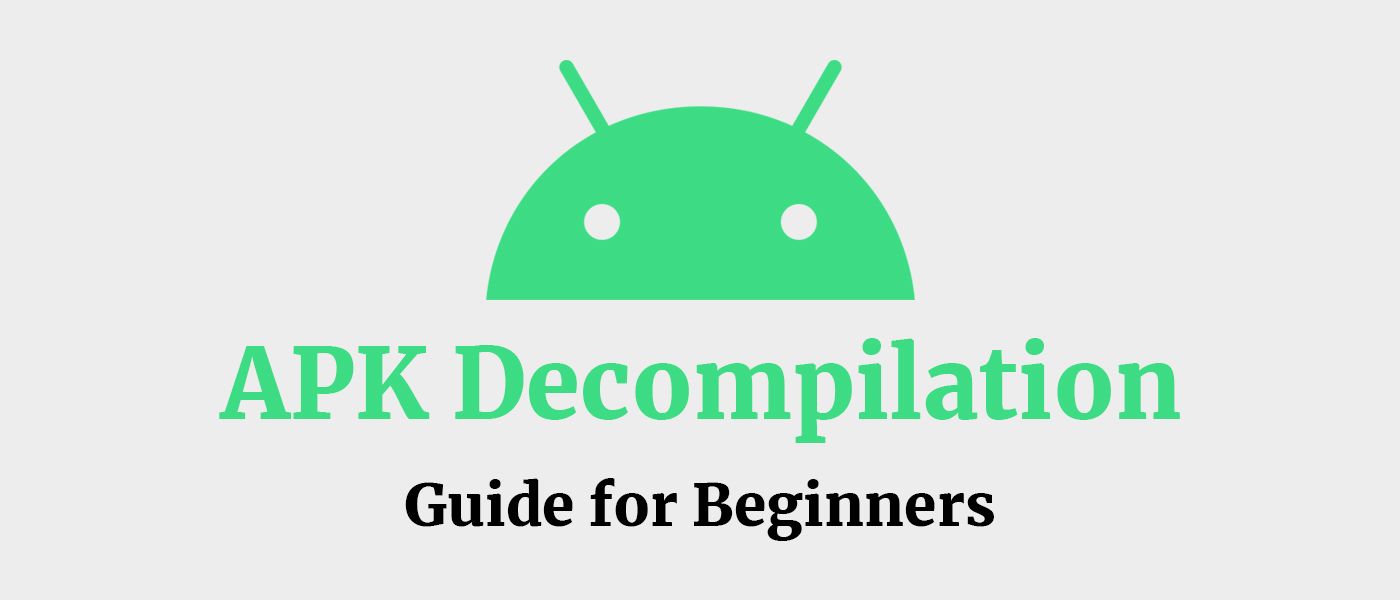
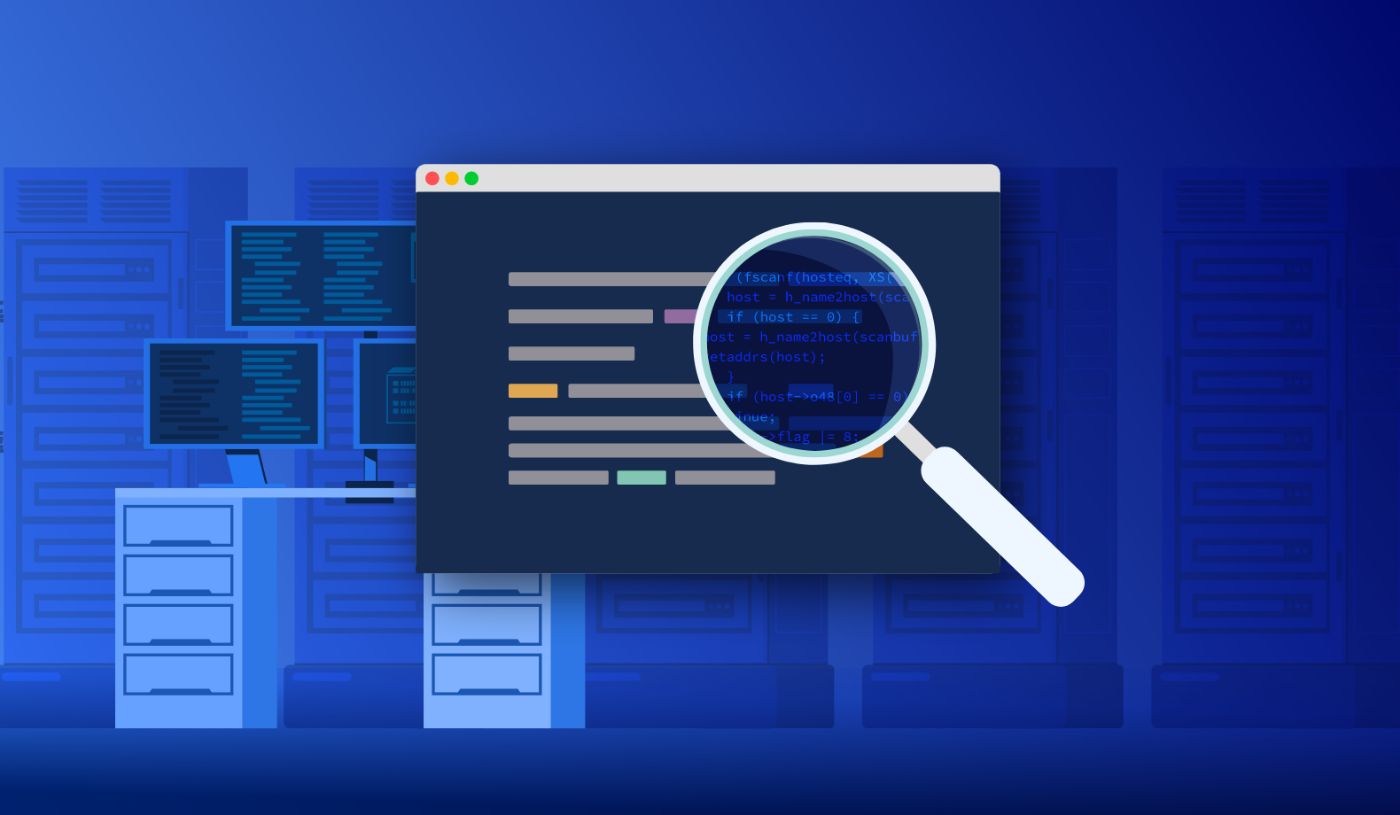
APK decompilation is the process of reverse engineering an APK file to retrieve its source
code. It is useful for understanding how an Android app works.
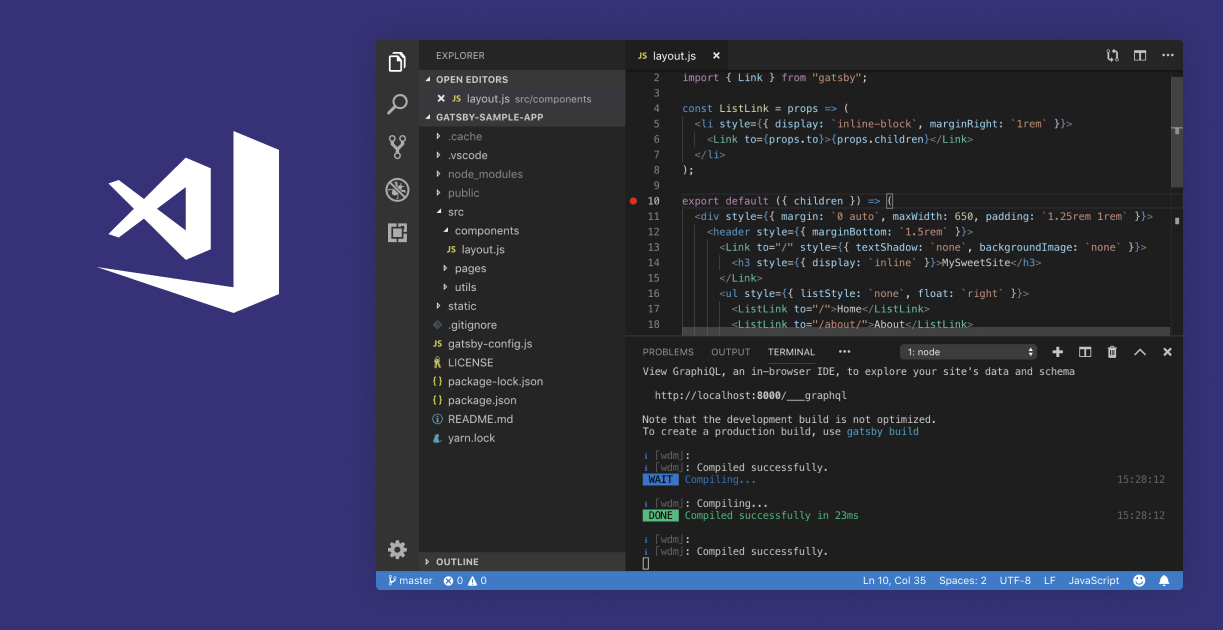
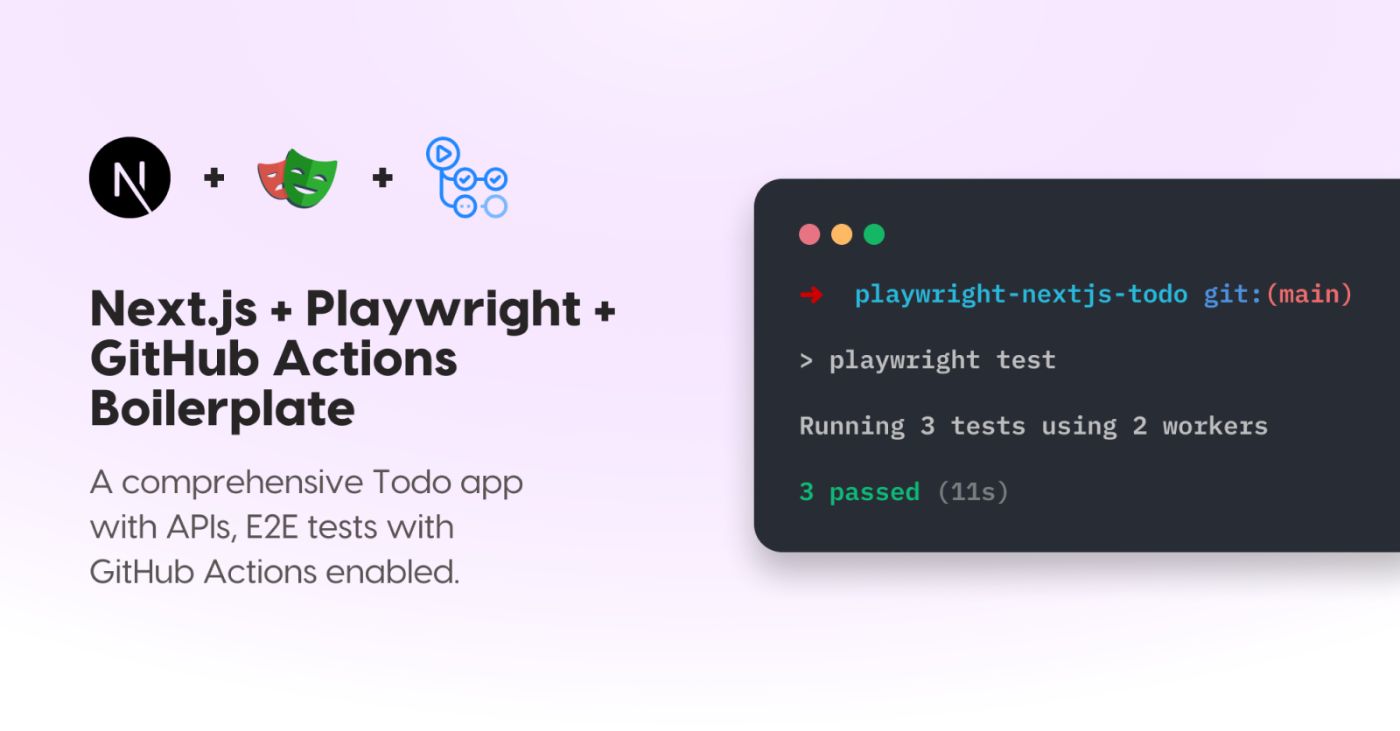
Next.JS allows the developers to create Server-side, Client-side or Static websites. Unlike the other frameworks, the rendering in Next JS is per page. That means, the "about" page can be static, while the "home" page can be server-side.
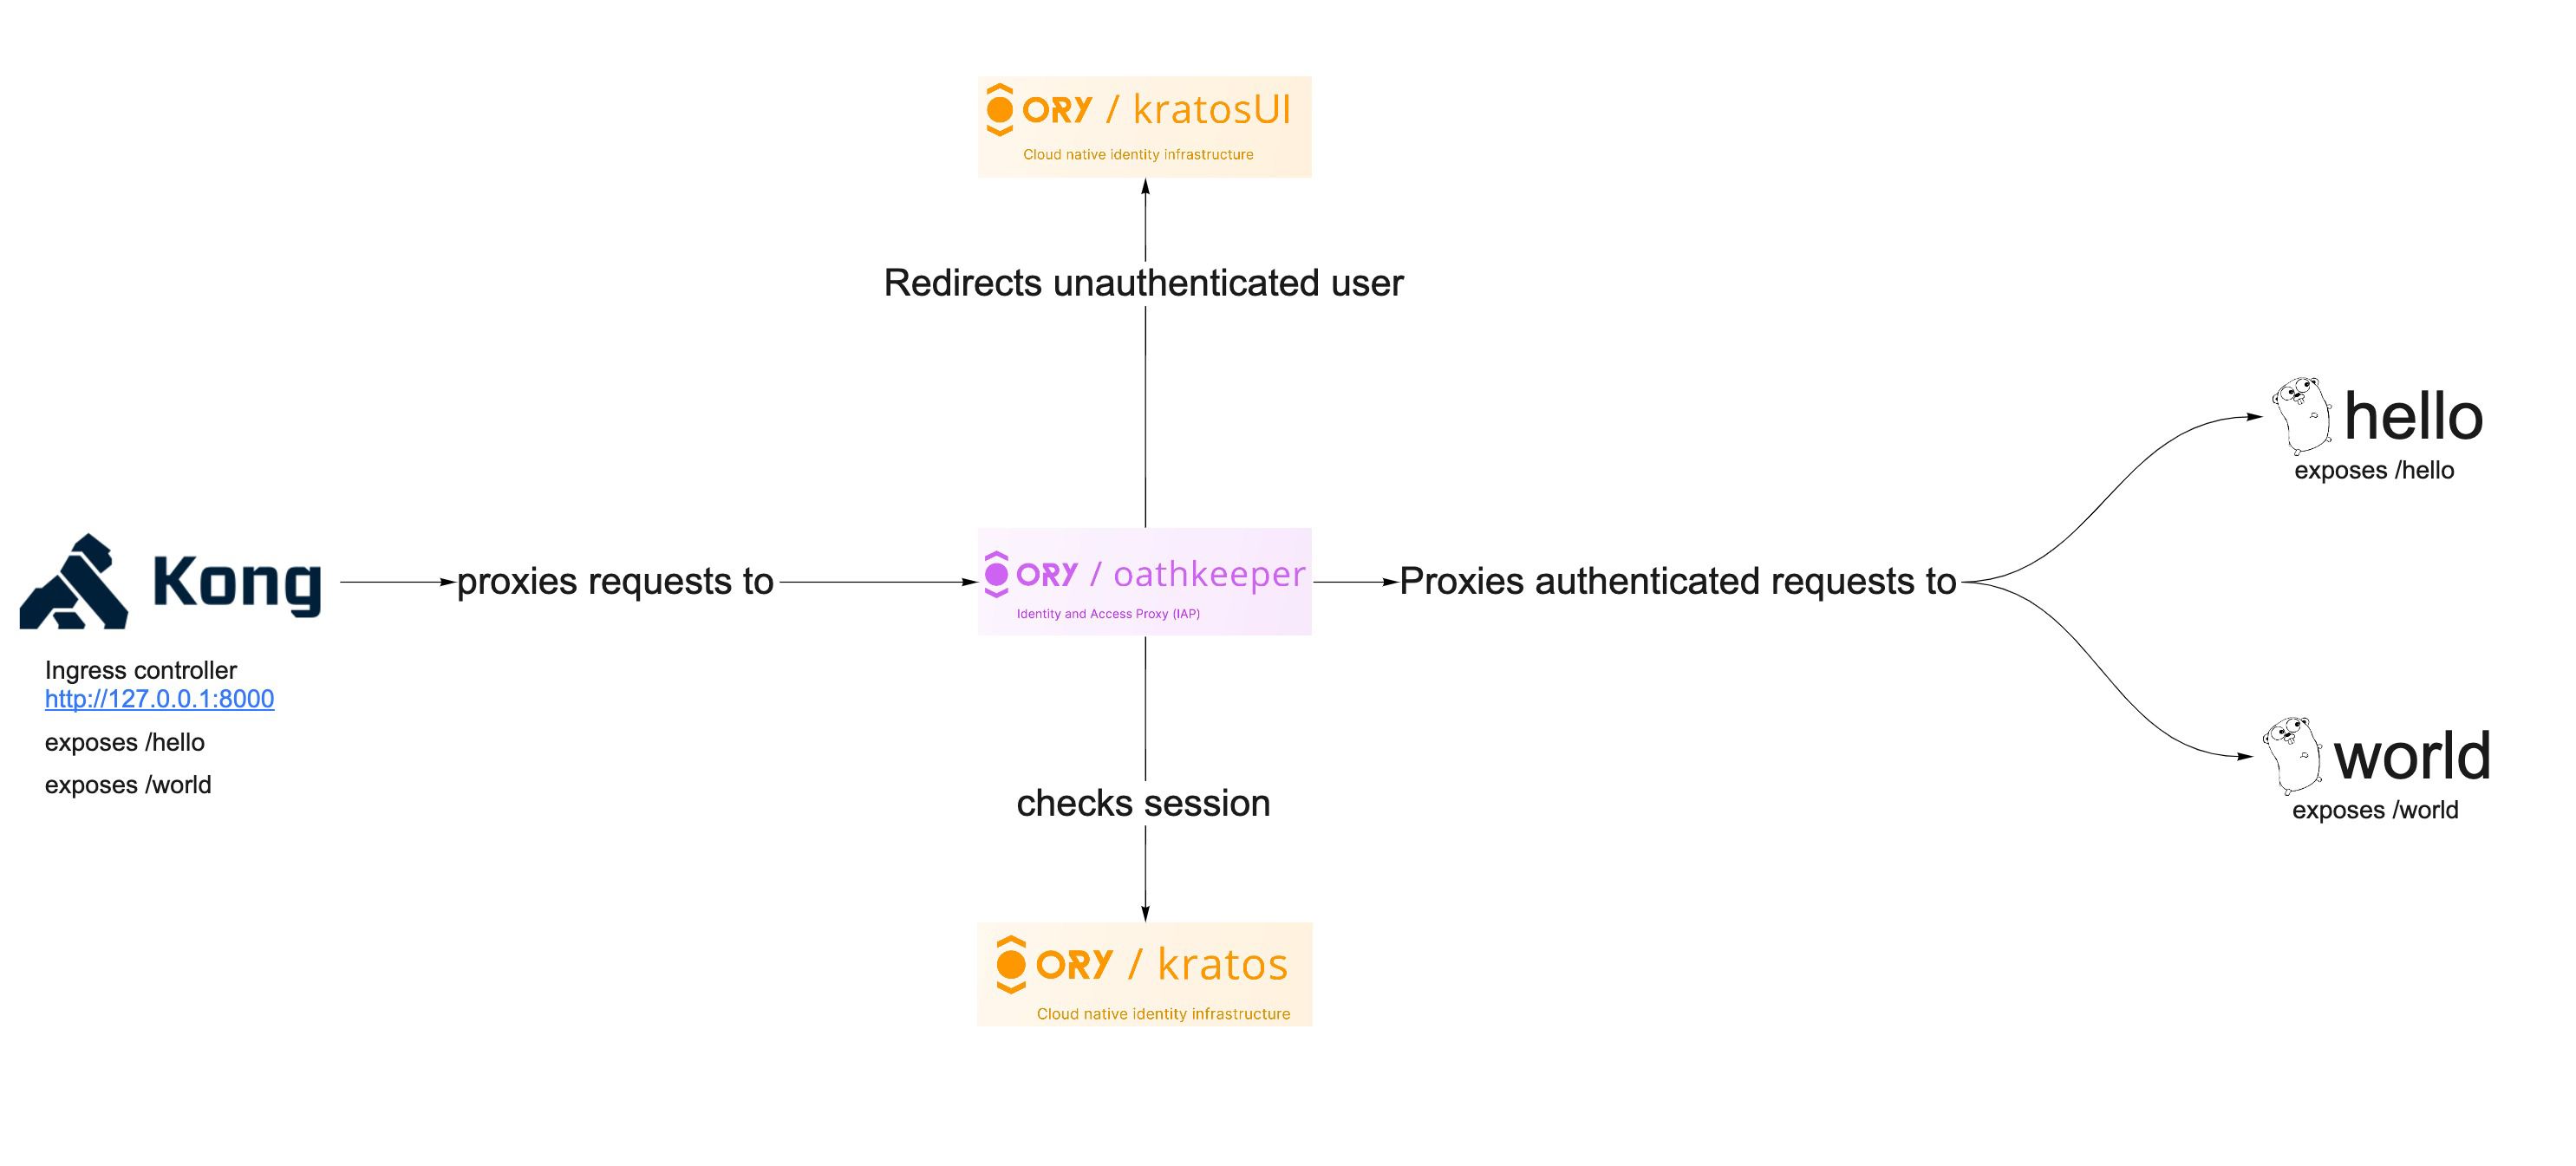
Microservice architecture is nowadays almost a standard for backend development. An API gateway is an excellent way to connect a group of microservices
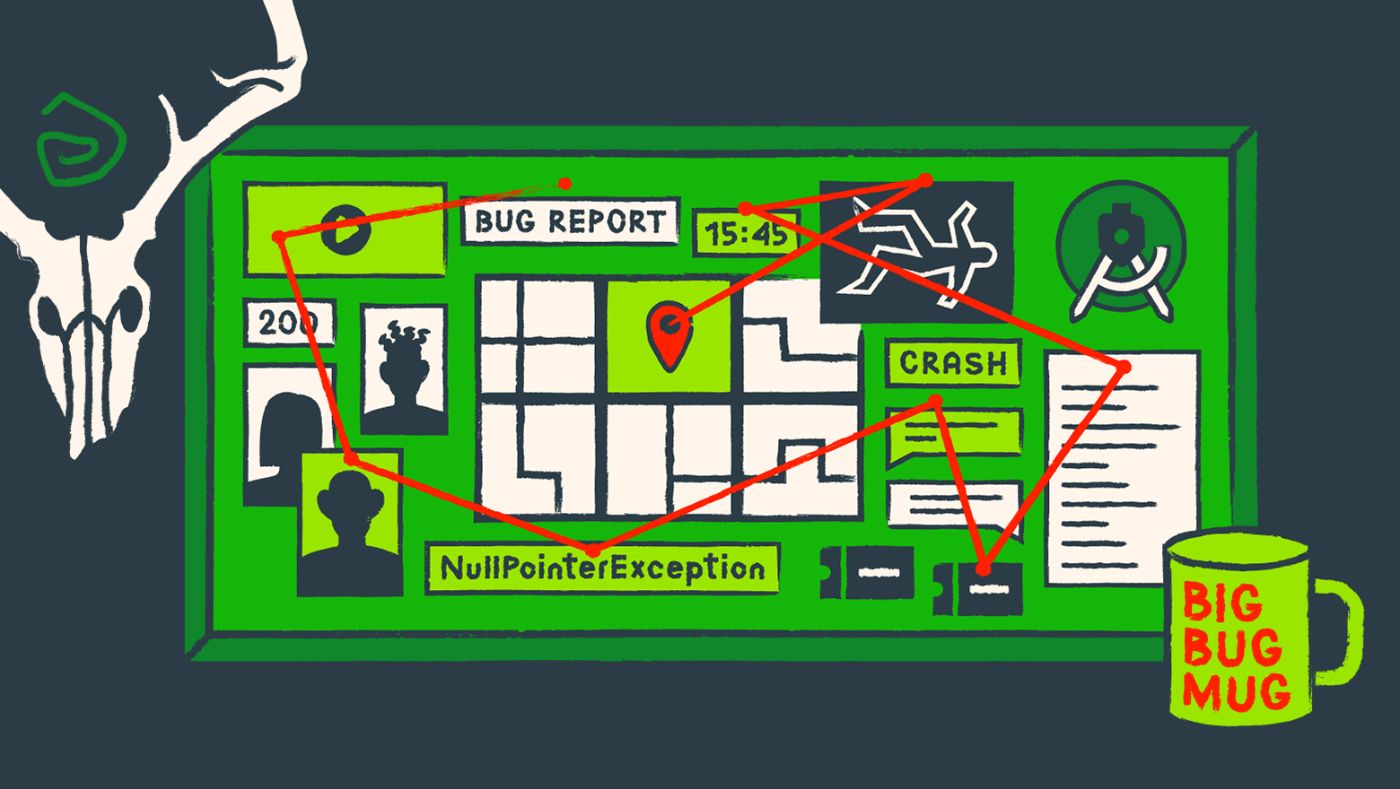
Bugs, like code, can be baffling and intricate. Why is there a random part of the screen glitching for no apparent reason? Is it the Matrix, your code, both?
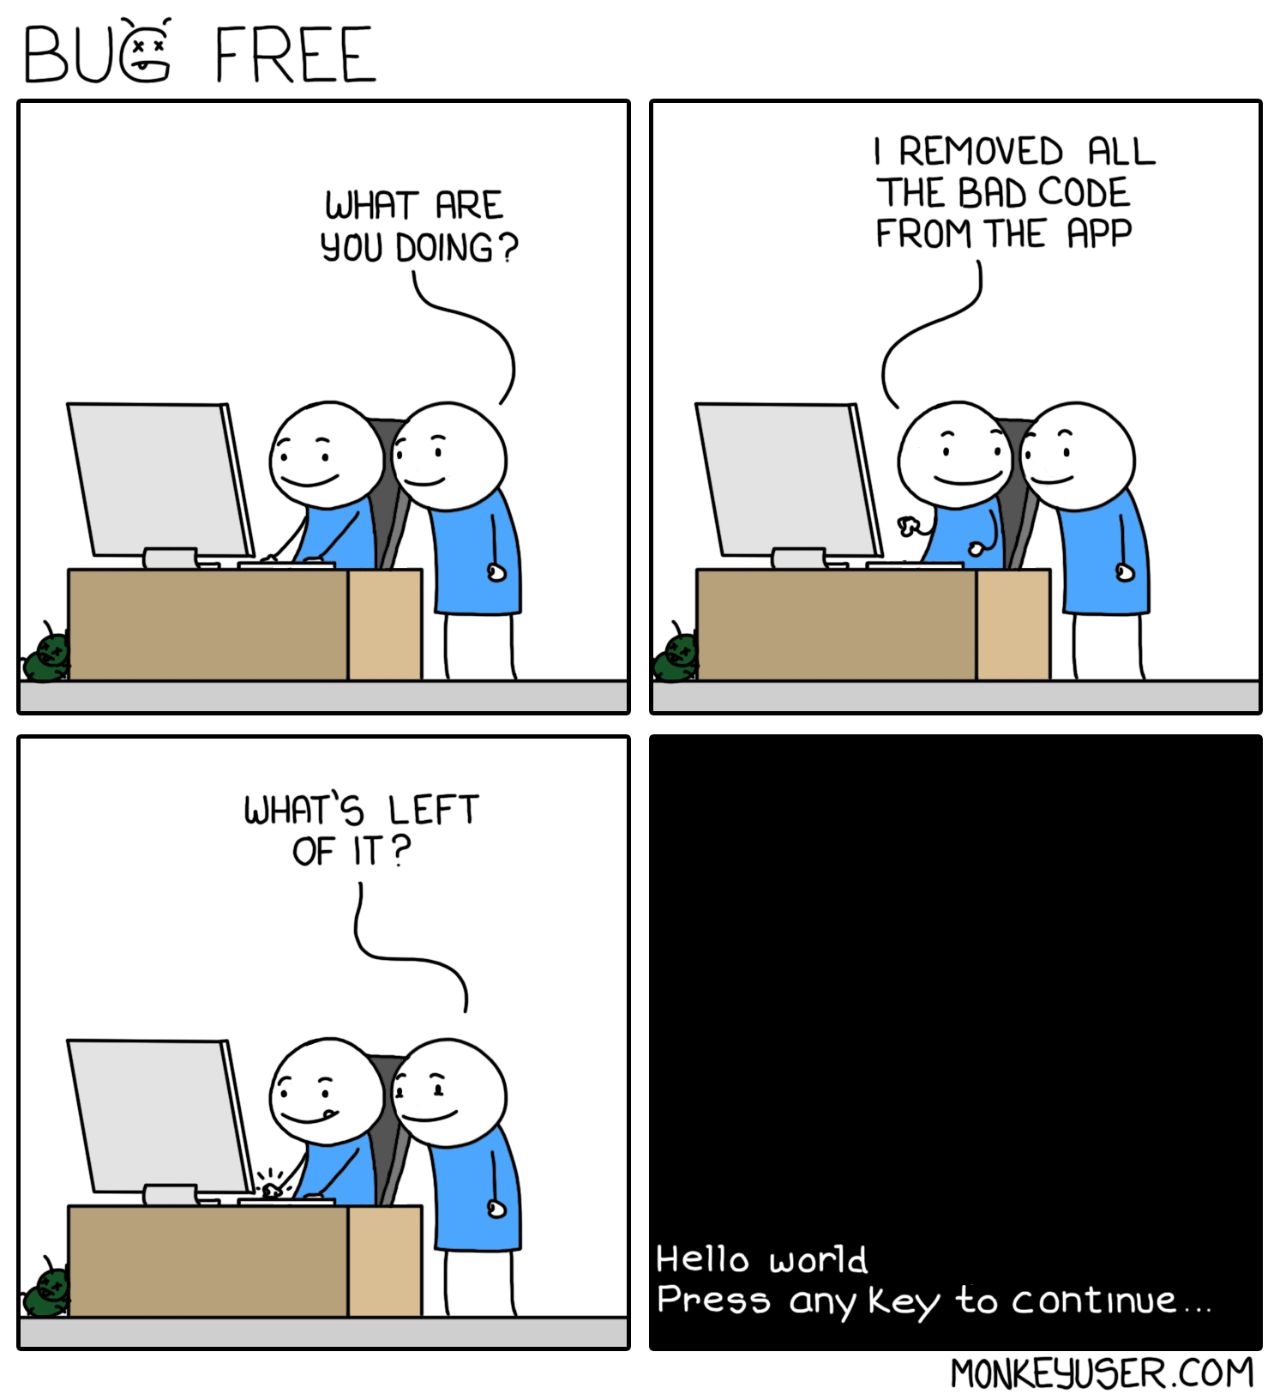
The reason why you should regularly declutter your code is that doing so saves you from having confusing bugs that are caused by unwanted pieces of code.
Trying to compile a .cu file is not supported in the VS Code natively. This can be a issue if you want to compile and debug (atleast the CPU part of the file as kernel debugging is not supported in VS Code at the moment).
By getting used to unit tests, they can start to familiarize themselves with the codebase and make significant progress while facing no risk or stress.
Debugging in a docker container isn't that straightforward. At least it is not in the way my team set everything up. I will describe my methods for debugging.
Frigidaire is the most reliable freezer brand due to its highest quality and excellent performance. Most people prefer this brand to others because of its attractive features, including a cooling system, a light that shows that the power is on, a temperature alarm, leveled stands, and numerous shelves for storage. Another added advantage to the Frigidaire freezer is the presence of a reversible door, which makes placement more flexible, thus more superb.
Docker, along with Docker Compose are the most used tools under the DevOps category, according to The State of Developer Ecosystem 2019 survey by JetBrains. Chances are if you're using Docker/Docker Compose for deployment, you'll most likely be using them for local development as well. If you only use Docker for deployment but a virtual environment for local development, you may want to look into using Docker for development to reduce the parity between dev/prod environments, as suggested in the Twelve-Factor Methodology.
From this article you’ll learn how tо
create Discord bot and add it to the Server;
get the full list of channels from the server;
get a snapshot of Discord memb
A year ago, I, the almighty mobile application developer, was brought down by a pesky bug that was causing my precious creation to crash frequently for users.
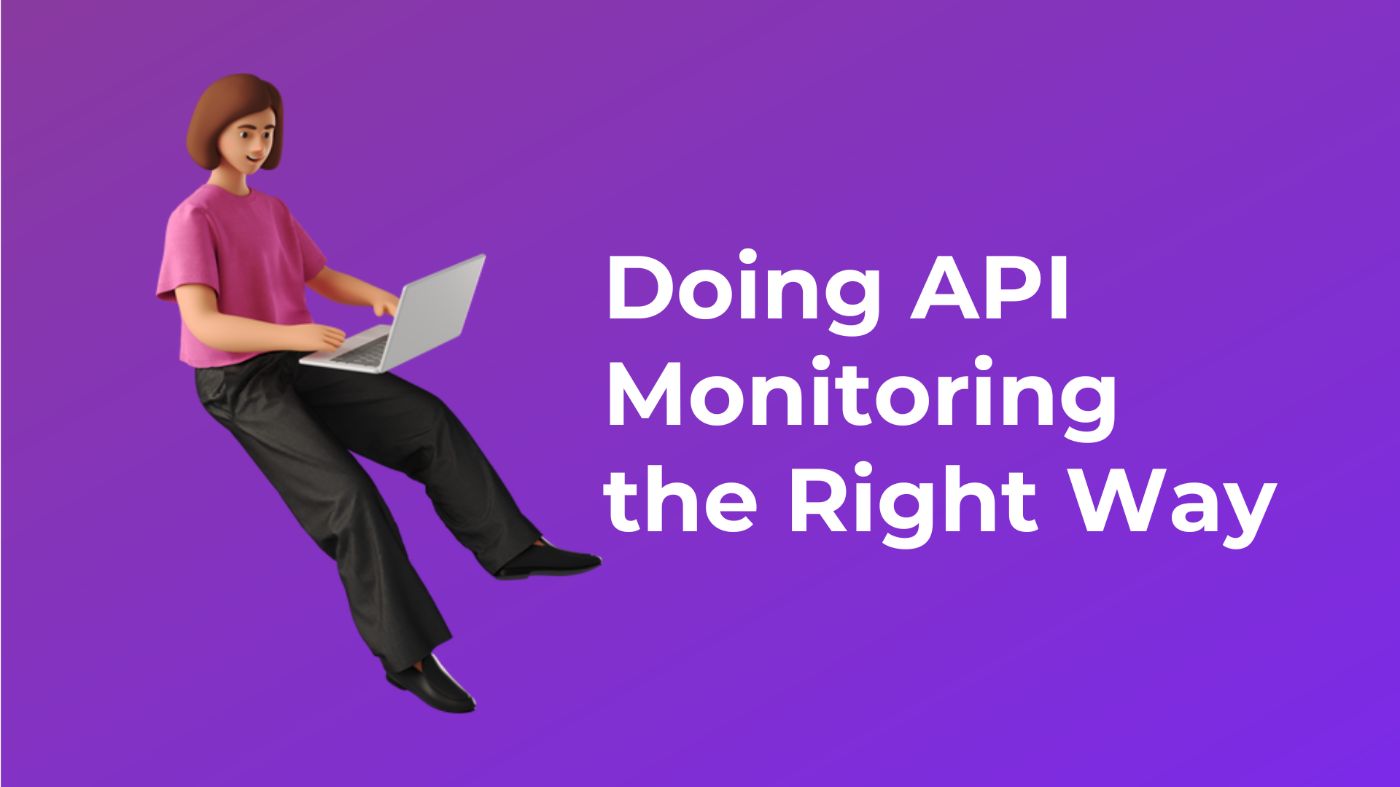
In this post, we'll go through the best practices for API monitoring, such as which metrics to prioritize and how to troubleshoot when an issue arises.
Straightforward moral of the story: always first check environment variables in CI settings. They can overwrite your configs and cause unexpected issues.
Hey Hackers! Sentry & HackerNoon are super excited to host a Debugging Writing Contest! Here’s your chance to win money from a $1000 monthly prize pool.
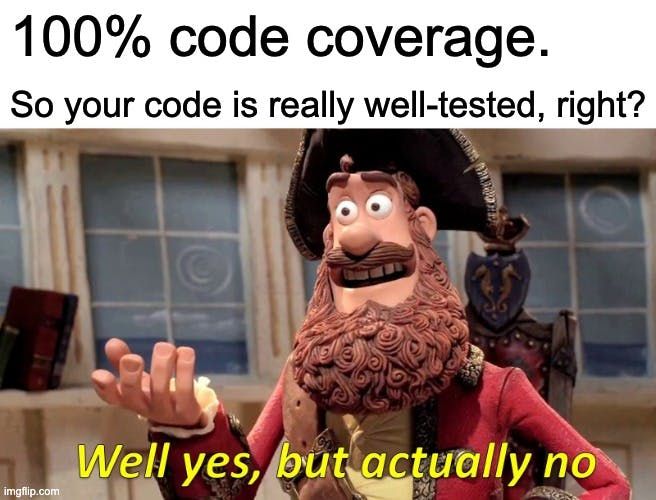
High unit test code coverage is often viewed as a key indicator of code quality, but it's important to focus on the quality of the unit tests, not just the cod
The article compares coding to building a castle with Legos and emphasizes the importance of following best practices to avoid mistakes and build a sturdy code.
In part 2 of the Bugsnag Beginners Series we will cover the error details page and how it can be used to maximize error debugging in your Bugsnag Dashboard.
Etherscan has a handy search utility which, along with its handy verification and decompiling features, lets you peek at the code of many ERC721 to compare.
Writing code that works when everything works as expected can be termed as Happy Path coding. It is a very good start. An experienced developer actually thinks all possible use cases and corner cases and make sure his code informs the users of the application even when an unexpected error happens. This level of coding is brilliant and the most wanted way to operate in Software Engineering.
If you have a team of programmers, but there is still no QA specialist, read the article to learn about why building a successful startup needs a QA specialist.
The Python Debugger (pdb) is an interactive source code debugger for Python programs. It provides added functionality like setting conditional breakpoints
Mobile app debugging requires the creation of bug reporting. In this article, I'll describe how to localize mobile app defects and create mobile app bug reports
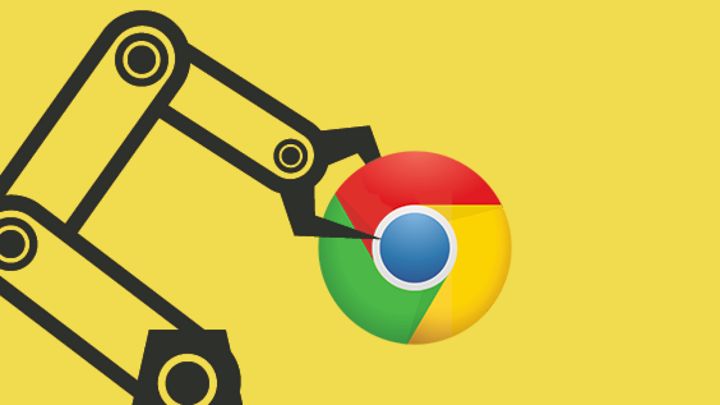
Learning about Dev Tools for techies is more like a need to stay a cut above. With the advent of advance technology, chasing behind new trends, learning and more importantly implementing those trends has now become an inevitable task. And since we don’t have much time, I would like to get straight to the point, i.e. how to debug with chrome dev tools. Also, you will learn how to fix bugs faster.
Join in as we solve a mysterious bug in a remittance app using detective skills inspired by Sherlock Holmes. Follow along as we share insights and best practice
While debugging applications is slightly easier than solving issues with K8s clusters, it’s hardly a straightforward task. Here are three ways to simplify it.
Debugging is a daily part of every developer's life. I usually go through a process when I encounter a bug that helps me move pretty quickly through issues.
Sidekick is a live application debugger that lets you troubleshoot your applications while they keep on running. Here is how you can start using it in 5 minutes
Piyush Badkul's work involves designing, deploying, scaling, and optimizing the core IMS network for the Indian Government's Telecom Technology Centre.
I've reviewed how to deploy KubeCF on EKS, which gives you a nice, stable deployment of KubeCF, for cost. Now let's run KubeCF on your Mac for free(ish)!
In this article I want to go over three big challenges we face when debugging modern applications: polyglot debugging, unreproducible and data pollution
Web modules are exclusive to Velo and enable you to write functions that
run server-side in the backend, and easily call them in your client-side code.
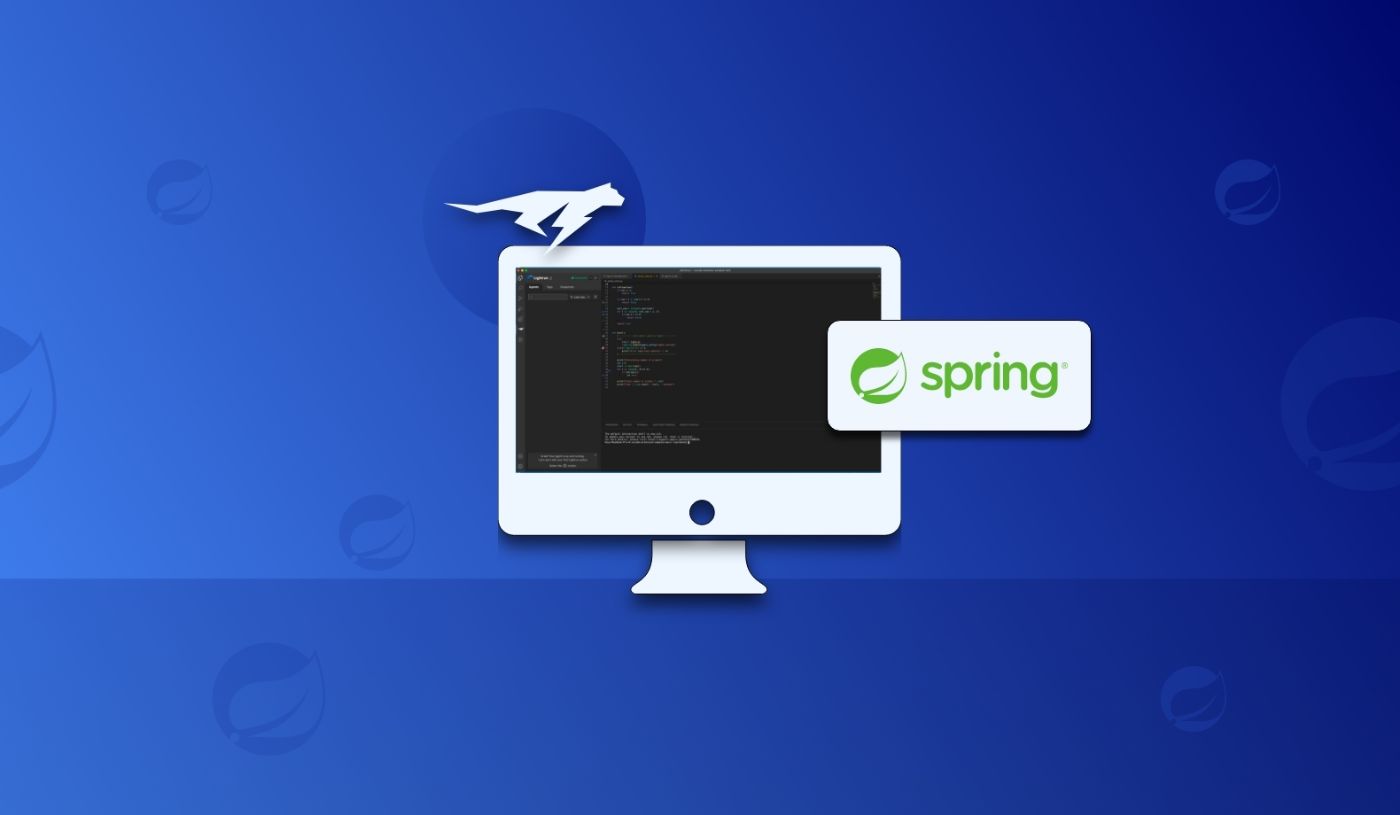
A Spring bean. Sounds relatively harmless, doesn't it? What if I told you that this could be the source of many headaches in web servers, especially if you are
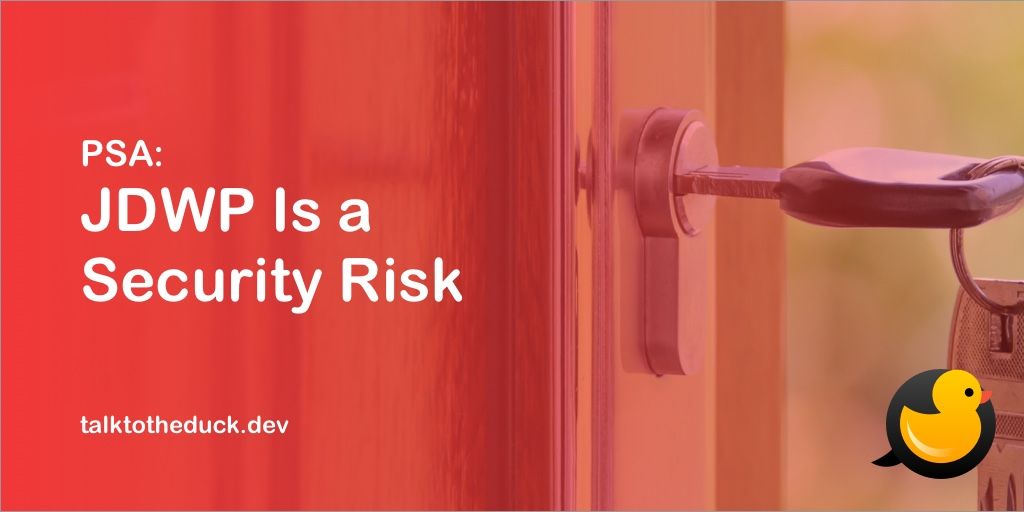
Calling JDWP (Java Debug Wire Protocol) insecure doesn’t make any sense. It wasn’t designed to be secure so it isn’t... It was designed for internal use only
React Native Debugger is a powerful tool that helps developers debug React Native applications more quickly. It provides a suite of impressive features, such as UI inspector, redux inspector, breakpoints and networking inspector. In this article, we are going to learn how to install and use the React Native Debugger, which will boost your development productivity by an order of magnitude.
Playwright is a testing framework to handle e2e testing. With Playwright we can write e2e tests and run them in different browsers, like Chrome, Firefox and Web
So many modern web applications, both client-side and server-side, use JSON Web Tokens (JWTs) for authentication, and this is an excellent approach. However when things don't work, it can be tricky to work out why. This post aims to give you some tactics for understanding and correcting problems with JWTs. If you're just getting started, check out the documentation on working with JWTs and our APIs first.
If you ask me on which task I've spent most of my time as a software developer, it would probably be bug fixing. Working with JavaScript apps, I've used console.log when debugging surely more than I should have. Learning how to become efficient at finding bugs in programs is a very important skill that can save you a lot of time. Debuggers help you with that task by providing tools to analyze your programs and run control execution flow.
Simple steps to create an Analogue Clock project with HTML, CSS, and JS and what the project can teach you about the development process and documentation.
April's winners of the Debugging Writing Contest, held by HackerNoon and Sentry! Take part to win money from a US$1000 prize pool with 4 winners each month!
Web automation is one of the best ways companies can test a product in development, especially the app's functionalities, such as clicking, scrolling...
I’m launching a new twitter video series that will focus on teaching the concepts of debugging (and other concepts) in small video bites this is the first video
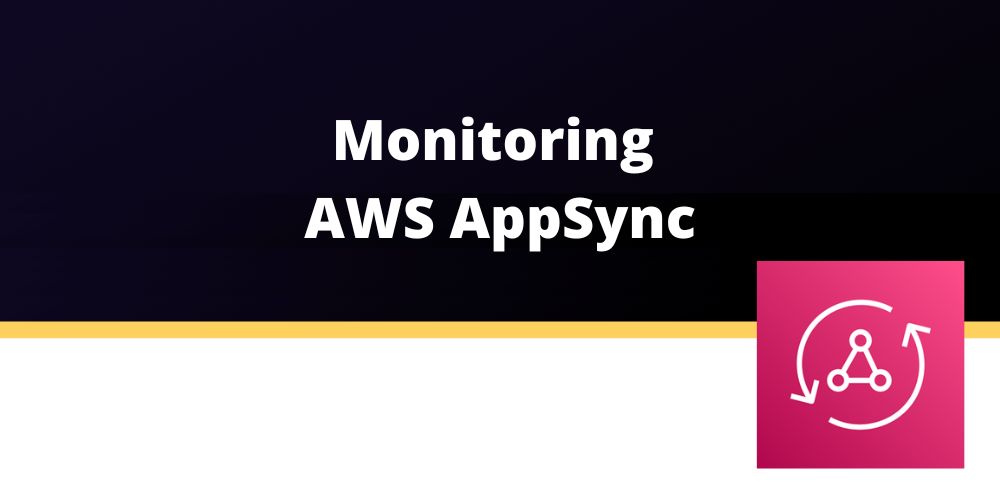
Learn what and how to monitor AWS AppSync to manage your APIs for GraphQL, effectively log changes made in your apps and other essential features for devs.
Tinder's "Top Spotify Artists" feature is relatively shallow, but could be fixed easily. Here is a demonstration of how it works currently and what can change.
You probably have heard of the idea of out-of-order execution, and that it breaks some common-sense assumptions about writing programs, and software has to insert barriers to make things right. That was a baffling concept to me at least when I heard of it. At the very least, why would the hardware want to execute out of order only to have the software correct the behavior back? What's the point? Is the software taking care of all the quirks for me? And if not, where's the catch?
Say goodbye to endlessly scrolling on Stack Overflow. Discover how ChatGPT can help developers debug their code efficiently with 10 practical use cases.
Everyone is familiar with CI and CD processes, but whatever happened to Continuous Feedback? Leveraging observability in dev creates a new type of dev process
Unit tests, which appear in the bottom layer, are cost-effective, take the least amount of time to run, and should therefore make up the majority of tests.
You may have exhausted all solutions to make your site render on the browser but nothing seems to work. Then, you’ve checked the developer tools console only to get an error saying that CORS is blocking your API requests.
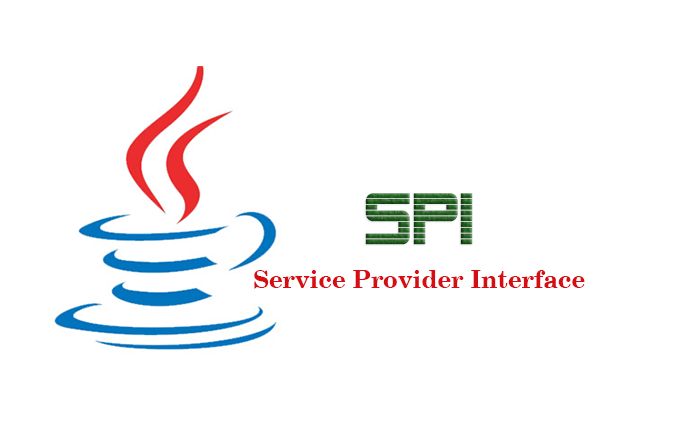
Compared to Dubbo, the ShardingSphere SPI is more streamlined, powerful, and easier to use. This post reviews Apache ShardingSphere’s SPI, and why it’s simple.
In this article, I will cover most debugging methods, basic and modern ones, introduce some hands-on tools and show some basic configurations and instructions.
The famous story about Quake, kiełbasa, pierogi, debugging and the birth of a new career in a small city in the middle of Poland that you were looking for
Communication is key in any project - yet, it’s especially critical during a penetration test. Because pentests are a point in time event with a time constraint, it becomes even more important to communicate any findings, blockers, changes to the environment, and/or any other variables that may turn into a hurdle for testers. Additionally, since pentesting can affect applications, environments and the access to them negatively, the importance of communication is amplified. Thus, the timing of communication is crucial to the success of the test.
Microservices exponentially increase the number of connections and remote work is the norm - how do we ensure tightly integrated components play well together?
Finally got through all the content around the much-hyped Fullmetal Alchemist in 2020, and I was not disappointed; quite the opposite. It evokes philosophical questions on the things we do and how we do them. So naturally, with software engineering for me.
“Users cannot open the app.“ This was the message causing chaos all over. So I did a quick installation of the app again, and to my surprise, the app was workin
Imagine that you want to inspect the app to see what’s information exchange between mobile app and server, you can think about using simple proxy tools to sniff requests and responses or more advanced techniques such as a reverse binary file to see what are endpoints, parameters, and response payloads…
This blog post shows how you can debug a simple Node.js application running in a Docker container. The tutorial is laid out in a fashion that allows you to use it as a reference while you’re building your own Node.js application and is intended for readers who have prior exposure to JavaScript programming and Docker.
Learn linux command by playing Leviathan wargame from OverTheWire. This wargame doesn’t require any knowledge about programming - just a bit of common sense and some knowledge about basic *nix commands.
When you use Render to deploy your Node.js application with Postgres database, you can debug easily with integrated tools like Datadog and Log Streams.
Dial up your debugging skills to 11 by leveraging some of the lesser known capabilities for debugging highly complex systems such as filters & wildcards
Scrum is a set of rules for organizing a flexible workflow, which consists of a team approach, working in iterations, focusing on the goal of each iteration.
When you are working on a huge project, you may discover bugs in the code that prevent you from proceeding any further in your development. How to fix them?
Read example issues around Courier’s Gmail integration and API rate limits, an incomplete data profile, and an incomplete request with Inbox and Toast.
Being experts in the IT industry, we at QAWERK know about the importance of testing and want to share this knowledge as we believe high-quality software is the key to success.
Let’s create a simple Angular application that will load the data of a github user, and then (not) beautifully crash when trying to load a non-existent one.
An article focused on deep diving into observability and its significance in software. Its history, goals, the importance of observability, and the issues that
Debugging in practice means getting lost on tangents, trying to look good in front of your subordinates and doing just a little bit of debugging on the side.
Michael Bargury spent years working on cloud security at Microsoft, bootstrapping security products that tackle emerging threats like IoT, APIs and IaC.
While powerful, Asterisk is not foolproof. One bug generates the 400 Bad Request SIP error and is caused by the incorrect use of Double Quotes in the process.
I have been playing around Android OS for a while and this post is one of the learnings I wanted to share. The misleading yet catchy title still points to the essence of this post - yes, we are going to talk about the VOLD demon. Sorry *daemon.
Learn to use OpenTelemetry to monitor and identify the database issues in your application and remediate them to optimise your database operations quickly.
Wix provides several tools for testing and debugging the code in your site. You can start by testing your site in Preview mode before publishing. If you see errors or your site is not running as expected, there are 4 tools you can use to debug the code in your site:
At PEAK6 Capital Management we operate a variety of different systems in
support of our trading teams. As we improve and evolve these systems, we
sometimes run into hurdles along the way that are not all that easy to
diagnose. This is the story of one of these hurdles our systems and core team ran into that came about while updating our pricing system.
How much time do you spend in debugging? Well, I know that the question is bit vague and the answer would vary. After spending close to 15 years in Computer Programming, I still can't say confidently how much time I really spend in debugging things. There could be multiple factors that influence it and make it uncertain to answer:
Continuous monitoring gives organizations near-instantaneous feedback and insights into performance, environments, and interactions across the DevOps pipeline.
APIs are stable until they aren’t. We talk about that often at Bearer. If you control the APIs, it gets easier, but with third-party APIs and integrations, it can be more difficult to predict when an outage or incident is about to happen.
Website Accessibility Tools help make sure that your website is well-equipped for users to access by testing common problems that many other sites experience.
App debugging is an essential part of the app development lifecycle. Bugs can be insidious, and we need to find them as fast as possible to get more time for fixing. Yes, of course, it would be great to write code without any issues that work just perfect, but we are people, and it’s a normal thing to make mistakes. In this article, you will read about some useful & fun tools that I prefer to use in my day to day iOS app debugging at Uptech. We will touch a few themes like:
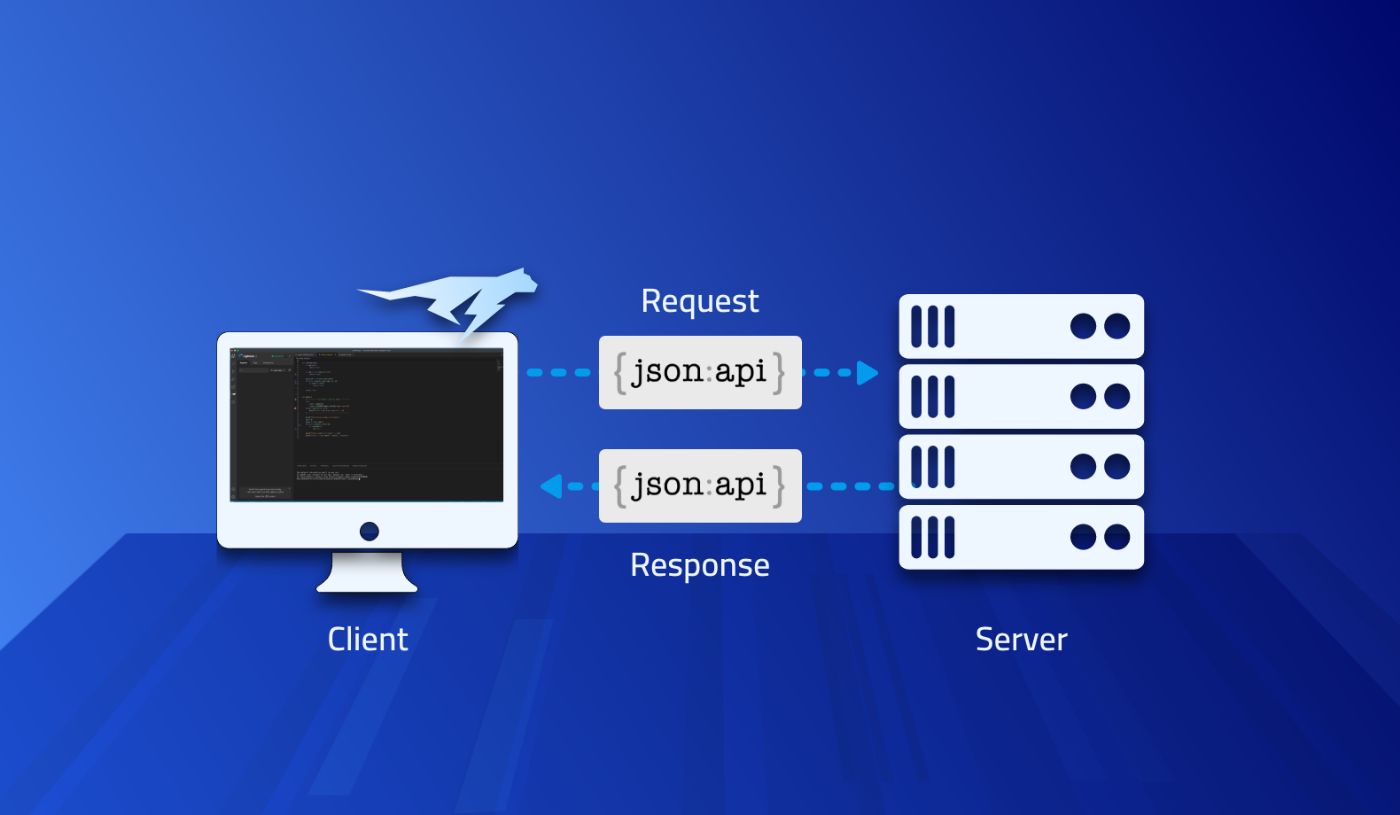
API (an abbreviation of Application Programming Interface) is a special interface (a set of commands/controls) that is designed for the interaction of different
Before you start reading this article, hit ALT+CONTROL+DELETE, then click on your task manager, and make a note of the CPU and Memory usage of Google Chrome.
The first time I wrote a code that contained an import statement, I made a stupid mistake even though I had 8 months of experience working with JavaScript.
Every web developer has, at a point in their development journey used one of the various dev tools available in the browser. I am talking about the console object which provides access to the web debugging console.
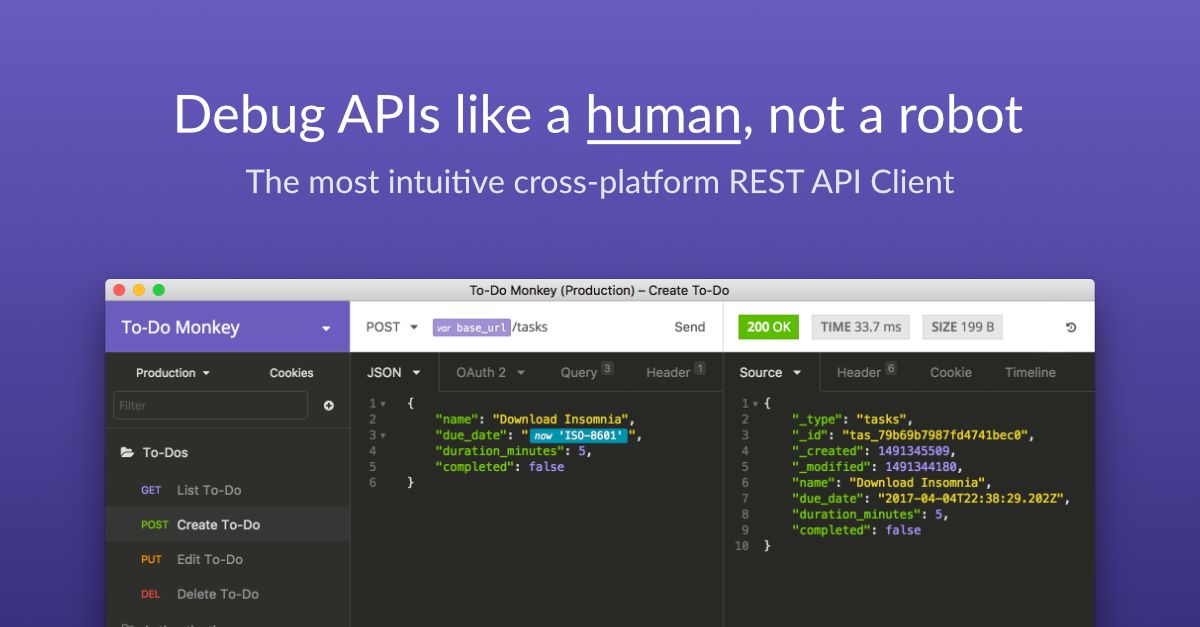
How to use Insomnia REST to speed up API development and testing? Environment variables, Requests Chaining, Requests History and other features to the rescue!
In this post, we take a surface-level look at the parts that make up DevOps. We explore the concepts, tools, and unique roles that make it work as it does.
Debugging is as important as writing code, it can cause your program to crash or behave unexpectedly. Most of the time, debugging can be very stressful, especially when one doesn’t use the right tools to debug.
The most important lesson in programming is learning to debug code. Here is a list of my favorite debugging tips and tricks in JavaScript, Python, and more.
The term Bug sounds like an excuse out of our scope infecting our systems. It is not. Software quality is under our control. It is our responsibility to deliver
In machine learning, it is crucial to have a large amount of data in order to achieve strong model performance. Using a method known as data augmentation, you can create more data for your machine learning project. Data augmentation is a collection of techniques that manage the process of automatically generating high-quality data on top of existing data.
The concept of instrumentation often refers to tracing where events happen in an application. Many application performance monitoring (APM) tools use it to provide metrics on the inner workings of your application. But sometimes, all you really need are details about API calls.
Ah yes—“It works fine on my machine!” Perhaps the most famous saying in our industry. Even with the advent of containers that provide consistent environments across the SDLC, we still hear developers fall back to this claim when a defect is found. But in the end, if the code doesn't work in test or production, it doesn't work—even if it works locally. So as a developer, being able to deep dive into your containerized application to fix the problem—regardless of the environment—is a critical skill we must all learn.